Download PDF
Download page Visualize Analytics Data.
Visualize Analytics Data
Related Pages:
After you have created a search for the Analytics data that you want to visualize, you can configure a widget to display the results of the search graphically.
Access the Analytics Widget Builders
You can access the Analytics visualization widgets from the Analytics Search UI or directly from Dashboards & Reports.
To access the Analytics widget builder from Analytics:
- Select Analytics > Searches to view the saved searches list.
Double-click the search that you want to visualize or add a new search.
To access the Analytics widget builder from a Custom Dashboard:
- From the top navigation bar, click Dashboards & Reports to see the custom dashboard list.
- Either double-click the dashboard where you want to add the Analytics widget or click Create Dashboard to create a new dashboard.
- In the custom dashboard, click Edit, then Add Widget.
- Click Analytics, Saved Searches, or Experience Levels.
- Add Analytics widgets as needed to your dashboard.
Build a Widget
To use the Analytics widget builder:
- Click the Visualization tab.
- In the Visualization canvas, you can create widgets with one of the following modes:
- In Drag and Drop Search (Basic) mode you can create multiple widgets on the canvas.
- In Query Language Search (Advanced) mode you can generate one widget from your ADQL query at a time. In addition, when you use the Visualization tab in this mode, the order of functions and fields in the query matters. For all widgets (except table), the aggregate functions, such as count(*), avg(), sum(), percentile and so on, should always be preceded by a field. If the fields and functions in the query are not in this order, some visualizations do not work.
- Click Add Widget, then select Custom Widget Builder or Funnel Widget Builder depending on the type of widget that you want to create.
In Basic mode, you can build custom widgets and drag fields to the canvas, which uses X and Y axes for configuration. After dragging a field to the axes, select a function from the drop-down next to the field name.
In this example, the percentile function is applied to HTTP Time (ms).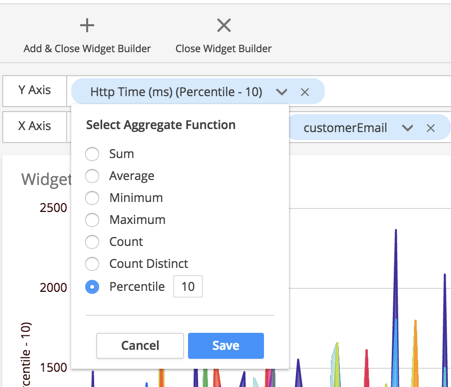
The funnel widget is configured differently from the other custom widgets, which use the Y and X axes as the basis of the configuration. A funnel widget is used to display data of progressively-staged proportions in a color-coded funnel.
You can add a title to the widget by over-writing Widget Title on the canvas. - After adding a widget and fields, you can right-click menu widget values to see other options. Select Apply a global filter for <field_value> to add a value to the existing search criteria.
The supported boolean operators are true, false, null, and is not null. Use is not null to check both boolean and non-boolean fields, such asloan amountorIsReached. - Click Save & Close to save the widget configuration.
Conversion Analysis Using Funnel Widget
Funnel analysis includes a series of events that lead towards a defined goal. For example, tracking user activity in a mobile app, a sale on an eCommerce website, online advertisements, and eventual purchase.
The funnel widget visualizes use cases such as:
- Retail application checkout drop-off rates from the point of adding items to the shopping cart to the actual purchase
- Business Journey drop-off rates from the point of applying for a loan to approving the loan
- Home mortgage loan approval drop-off rates from submitted application to approved applications
- Impact from performance issues by total sales, customer segment, location, and purchased products are gauged in a funnel with other health rule widgets
In this custom dashboard, the impact from performance issues by total sales, customer segment, location, and purchased products are gauged in a funnel with other health rule widgets. 
Funnels return the number of unique actors that successfully (or unsuccessfully) make it through a series of steps. Actors could mean users, devices, or any other identifiers that are meaningful to you. A funnel analysis reveals where a given flow loses the most actors. This helps identify areas for improvement, as well as the overall health of your business.
The first step in the funnel is the anchor step, and always represents 100% of the results. The filter criteria for the first step creates a set of unique values, and every subsequent step results in a subset of the values from the previous step and renders the corresponding drop-offs. The second and later steps describe the number of events that match the criteria for each step towards the goal. This number is typically less than 100%, but could be 100% if every event matches the subsequent steps.
Build a Funnel Widget
- From the Analytics Search page using Drag and Drop (Basic) Mode, select the Visualization tab.
- Click Add Widget > Funnel Widget Builder.

In the Funnel Definition pane, click the down arrow to select the unique field representing the items that you are counting. In this example, following the steps of a loan approval process,
LoanIdis used. The fields depend on your application. There is a limit of 50,000 unique values for the first step. If you encounter this limit, you can try decreasing the global time range and look at fewer values at a time.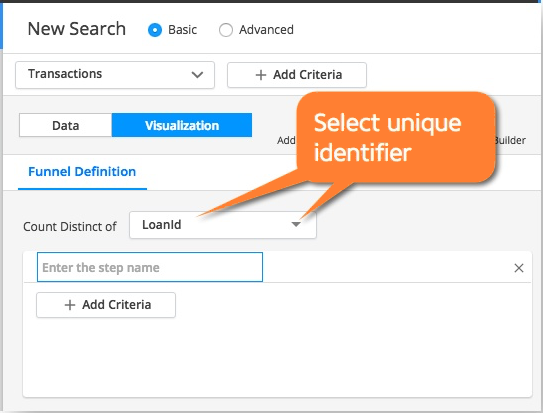

Filtering on fields with null and empty values may cause more records in subsequent levels.
- Label the first step and continue to add steps as needed for your application process.

For this example, the first step represents the number of submitted loan applications. The search criteria include the AD-Capital application and the/portal/SubmitApplicationbusiness transaction.
Alternatively, you can setSubmitApps.milestoneReachedtotrue.
- Continue to add and label your steps. This step represents the number of loan applications that reached the stage "Documents Verified."

Alternatively, use themilestoneReachedfield and set it to true. - After you have added all the necessary steps, click Add & Close Widget Builder to save the completed funnel widget. This example contains two additional steps representing loans that reached the credit check and approval stages.

If you want to cancel editing and revert to the previous version, click Close Widget Builder.
If the funnel steps need a rearrangement you can simply reorder them by simply dragging and dropping each step into appropriate positions. - Once you finish building your funnel, remember to name and save your search result.

- To add the finished funnel widget to a custom dashboard, click Actions > Add to Dashboard.

Use the Funnel to Troubleshoot
The finished funnel widget for the above example shows the drop-offs (Abandoners) in unique loan IDs from submission to approval. When creating the funnel, you can also select Show Health in the properties pane to display a health overlay that correlates application health data with the business conversion data. This helps to visualize performance for each step of the funnel widget.

The health overlay is supported for these events types with a user experience value:
- Transaction Events –
userExperience - Browser Records –
pageexperience - Mobile Snapshots (Network Requests) –
networkrequestexperience - Web Session Records (Browser Sessions) –
experience - Mobile Session –
networkrequest.networkrequestexperience
For enhanced troubleshooting, you can drill down to event data from any of the funnel steps by double-clicking the numbers on conversions and abandoners or by using Health Overlay and clicking on each health segment.
Configure Custom Widgets
To configure custom widgets for your analytics searches:
- From the Analytics Search page using Drag and Drop Search (Basic) Mode, select the Visualization tab.
- Click Add Widget > Custom Widget Builder.

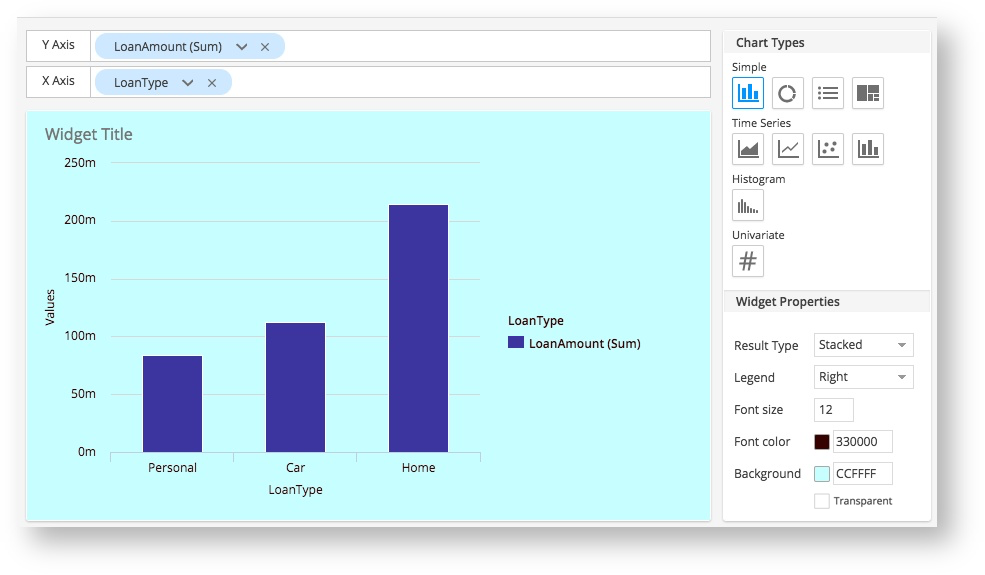
- To add a field to a widget, drag the field from the Fields panel on the left to the Y-axis or X-axis on the right. The available fields are based on the fields returned by the search.

- From the Chart Types panel on the right, click the widget type to use for the display. The widget is previewed in the main panel. You can experiment previewing which widget type is best for visualizing a particular data set.
- Usage for the X and Y axes depends on the chart type. The UI prevents you from adding more fields than the widget supports. Different widgets have different limits for the maximum number of fields permitted on each axis.
- For the time series widgets (area, line, scatter, and histogram), you can use the Resolution field that appears on the X-axis to customize the frequency displayed if you do not want the widget to automatically select a default resolution based on the current time range. This time resolution field is not counted toward the field limit. The granularity of resolutions that can be chosen depends on the Global time range.
Custom Widget Builder Data Type and Field Restrictions
Widget Type | Data Type | Number of Fields on Y-axis | Number of Fields on X-axis |
|---|---|---|---|
Column (simple) | any | zero | up to two |
one | up to two | ||
two or three | zero or one | ||
| Pie | any | one | up to two |
| Table | any | one | up to ten |
| Tree Map | any | one | up to two |
Time Series (Area, Line, Points, Column) | any | zero | one |
one | one | ||
two or three | zero | ||
Percentile Histogram | numeric | zero | one |
| Numeric (Univariate) | any | one | zero |