The Crash Dashboard aggregates mobile application crash data over time, using the Events Service. This service collects and stores all the data collected by the mobile agent.
The Crash Dashboard is divided into two panels and has the App Version dropdown that enables you to view crash data for different versions of your application.
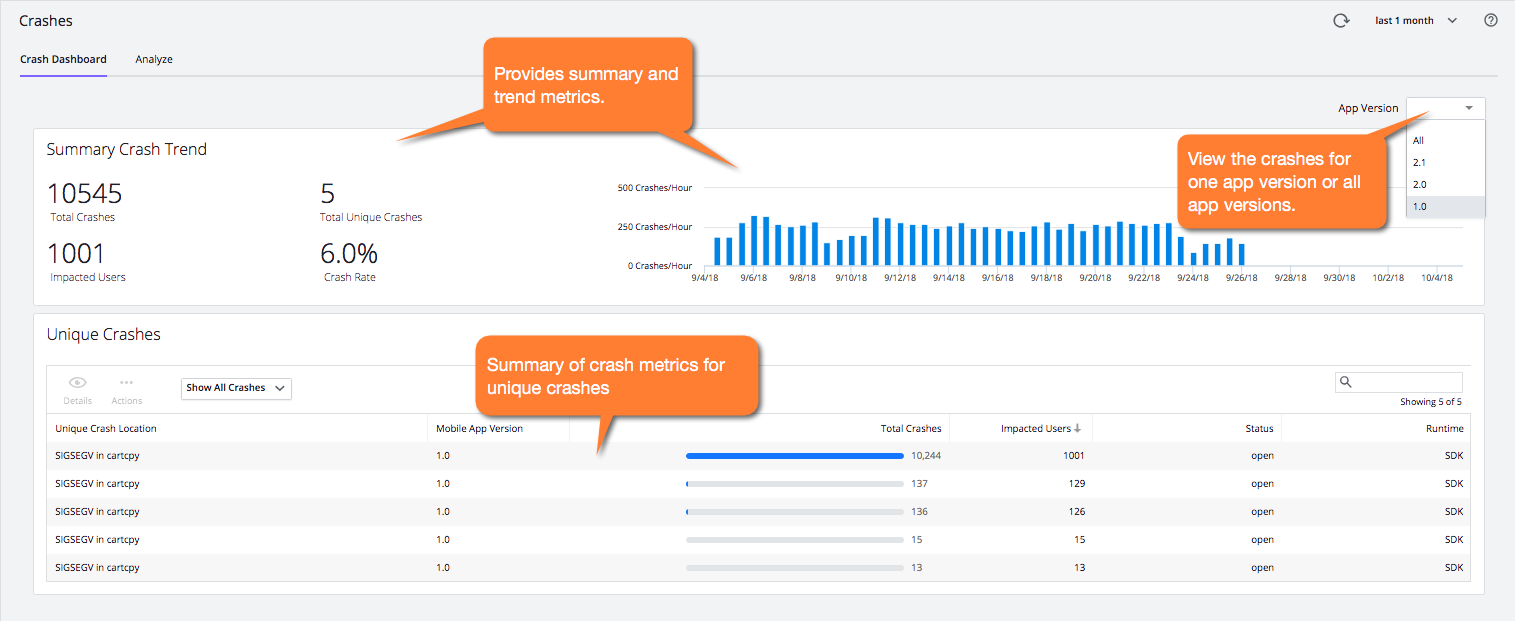
Summary Crash Trend
This panel displays a running total of crashes, unique crashes, impacted users, crash rate, and crash trends. The crash trends is a timeline of crash rates. It also reports any iOS crash reports that were uploaded without the accompanying dSYM file. For more information on how to use dSYM files with crashing reports, see Get Human-Readable Crash Snapshots.
Unique Crashes
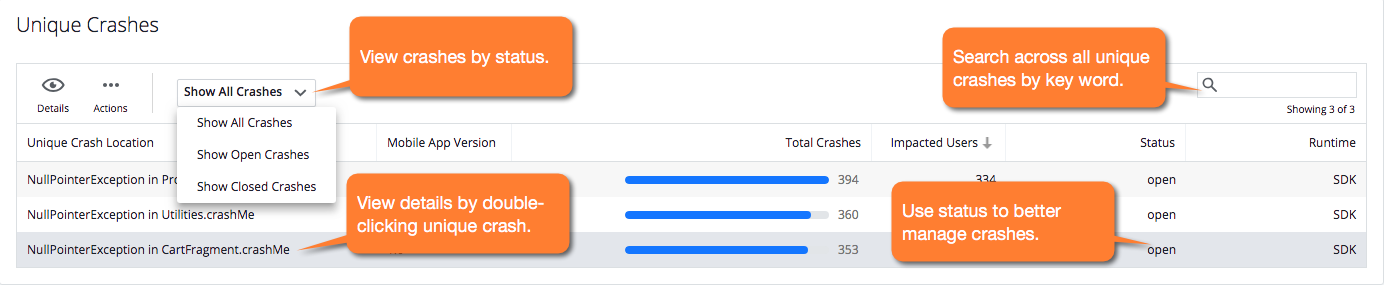
Multiple crashes can be caused by the same underlying code issue. The Unique Crashes panel displays a list of crashes grouped by common characteristics and displays basic information about the crash. You can view open, closed, or all crashes.
Unique Crash Details
To see more detail per crash, click the crash that interests you, in blue. The dashboard for that crash appears, with a header, trend bar graph, crash distribution charts, and a snapshot of the crucial details common to all the crash snapshots. See the Crash Summary section on the Crash Analyze page.
Crash Status
In addition to viewing crash details, from the Unique Crashes panel, you can select a unique crash, click Actions, and set the status to either open or closed. You can set the status to mark those unique crashes that you want to ignore or have fixed the root cause of.
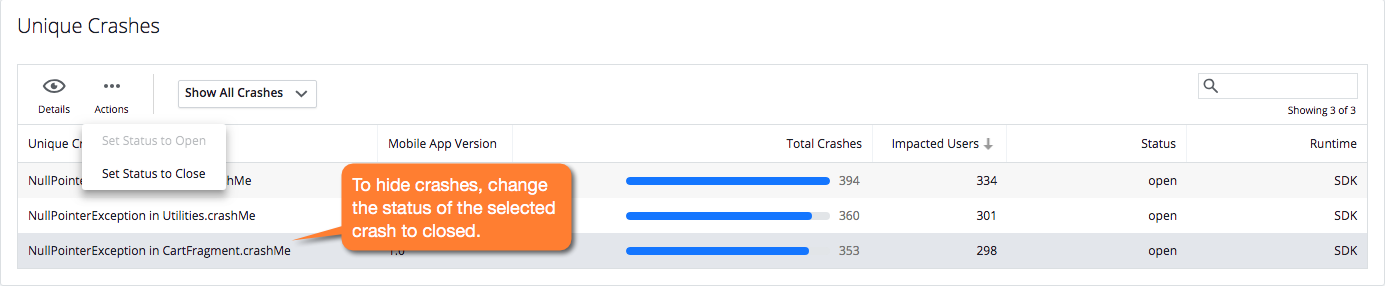
When a crash is marked as closed, the crash will no longer trigger a new crash event, so you will not see the crash in the Events widget of the Mobile App Dashboard, the Events page, and it will not be included in alerts for new crashes.