Download PDF
Download page Mobile Sessions.
Mobile Sessions
Related pages:
By default, sessions begin when a user starts using your application and ends after a configurable period of user inactivity. You can also programmatically control sessions through the Mobile Agents SDKs (Android, iOS, Xamarin, Cordova). Using Mobile Sessions, you can analyze sessionized results from all requests, as stored in the AppDynamics Events Service.
As in Network Request Analyze, the main Sessions panel is comprised of these tabs:
You can also view detailed information about each session in the Session Details dialog.
Records
The Records tab lets you scan individual sessions and allows you to filter and sort to get exactly the data in which you are interested.
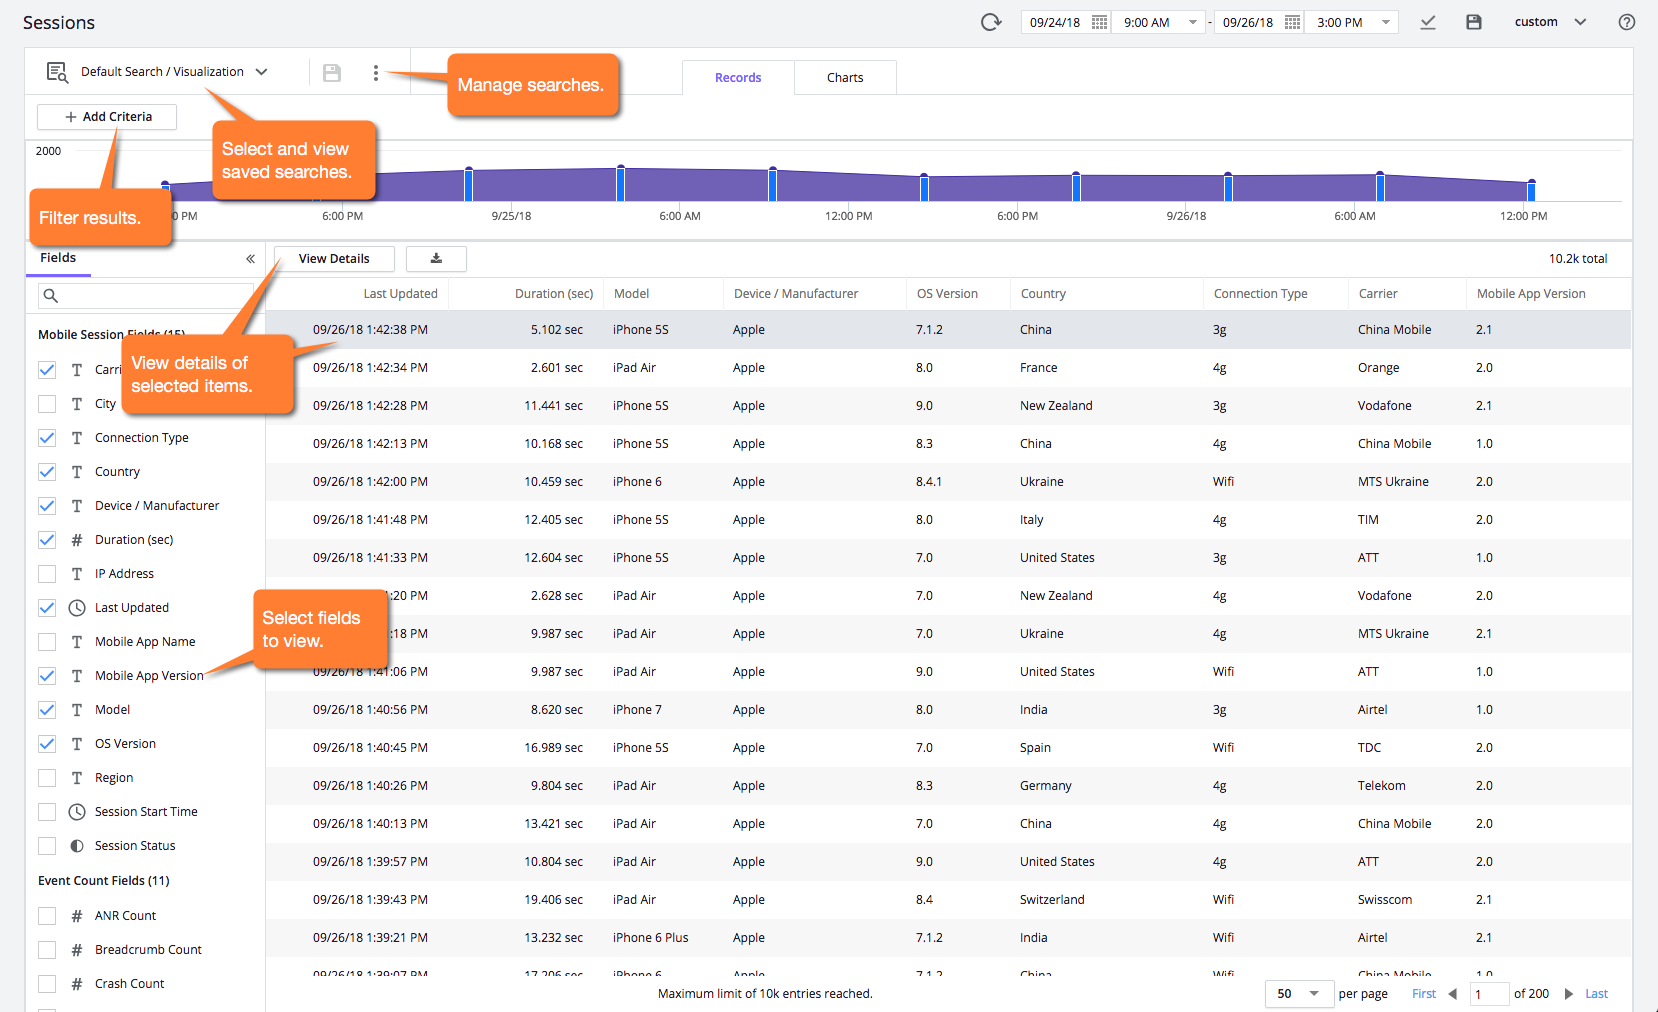
Session Details
Click View Details or double-click an item to see the information for a specific session.
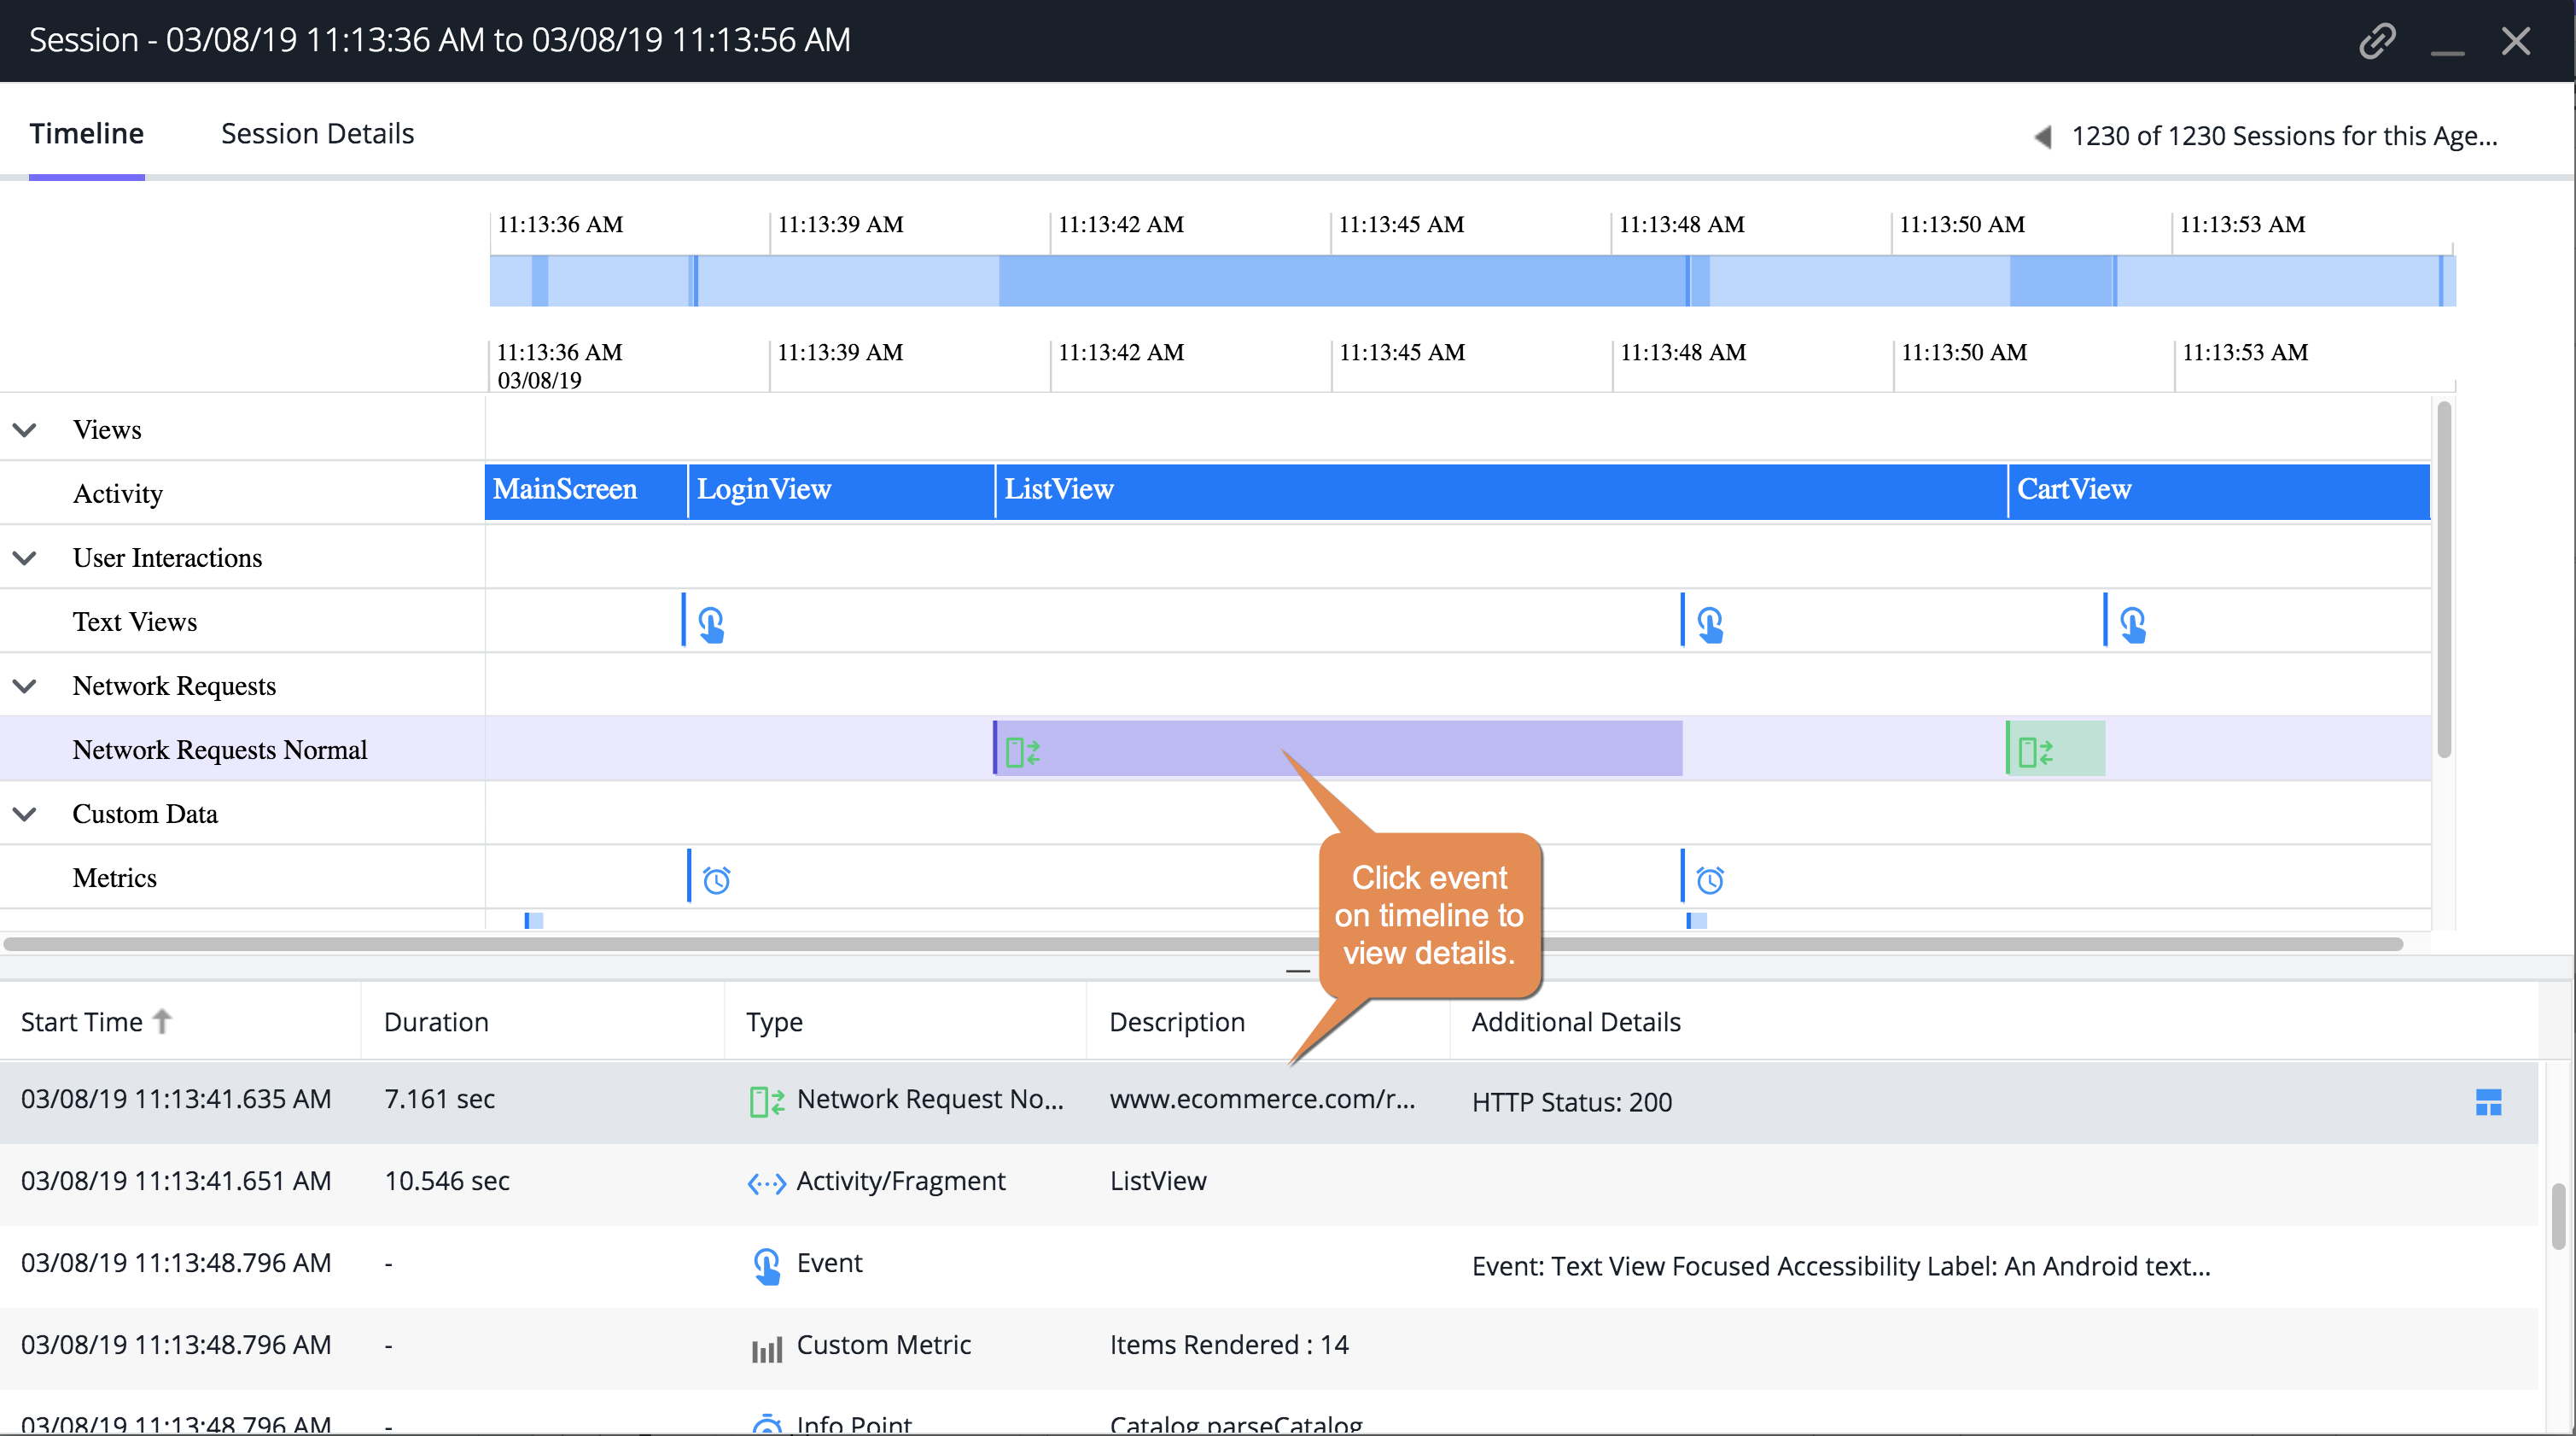
Session Timeline
The sequence of session frames for the session is shown on the session timeline and on the bottom of the panel. Select a specific frame by clicking on an icon on the timeline to see details highlighted at the bottom of the panel. You can also select a frame row at the bottom to see it highlighted on the timeline.
Session Details Categories and Types
| Categories | Subcategories | Type | About |
|---|---|---|---|
| Views | Activity |
| The current Activity in the foreground of an Android app. If the current Activity is not sufficient to understand what the user is doing, consider using the Session Frame APIs. |
| RootViews |
| The current RootView in the foreground of the iOS App. If the current RootView is not sufficient to understand what the user is doing, consider using the Session Frame APIs. | |
| Session Frames |
| A manual API to label large user activities that are not captured out of the box by Activity or RootView tracking. | |
| Screenshots | - |
| If you have configured mobile screenshots, they will appear in the timeline. They capture user events, and they can also be collected when in automatic mode. |
User Interactions | Touches |
| If you have enabled the Mobile Agent to capture UI events, you can view the UI events triggered by user interactions in the Timeline. See "Enable User Interaction Capture Mode" (iOS/Android) to learn how to capture UI events.
If automatic screenshots are enabled, touches will be captured and include the screenshot that was captured at the same time. The touches are drawn on the screenshot. |
| Buttons | |||
| Table Cells | |||
Text Views | |||
Text Fields | |||
| Network Requests | Network Requests Normal |
| Network requests include the requested URL, duration, and status details of the HTTP request. To jump to more Network Requests details, click |
| Network Requests Slow |
| ||
| Network Requests Very Slow |
| ||
| Network Requests Stall |
| ||
| Errors And Warnings | Application Not Responding Issues (ANRs) |
| You can view when the application was non-responsive in the timeline. ANRs are reported when the UI thread does not respond to an event for two seconds or more. To download or view the ANR Summary, click |
Crashes |
| When an app crashes the subsequent activity will appear in the timeline. To download or view the Crash Summary, click | |
Errors |
| ||
| Custom Data | Metrics |
| Custom metrics display integer-based data on any metric you define in your application. |
| Timers |
| Custom timers display how long something takes between any arbitrary start point and end point, even if they span multiple methods. | |
| Info Points |
| Information points display information on how a specific method in your code is performing. | |
| Breadcrumbs |
| Breadcrumbs are short messages to mark interesting events in a session, controlled by the Breadcrumb APIs in the agent. | |
| System Events | Connection Transition |
| Connection transition indicates when a broadband transition has taken place, such as from Wifi to cellular. |
| Agent Init |
| Agent Init indicates when the Mobile Agent was first initialized. It can help with debugging the application lifecycle. |
View Options
You can filter the categories in your timeline view by clicking View Options. Check all relevant categories for your search. All view options are checked by default.

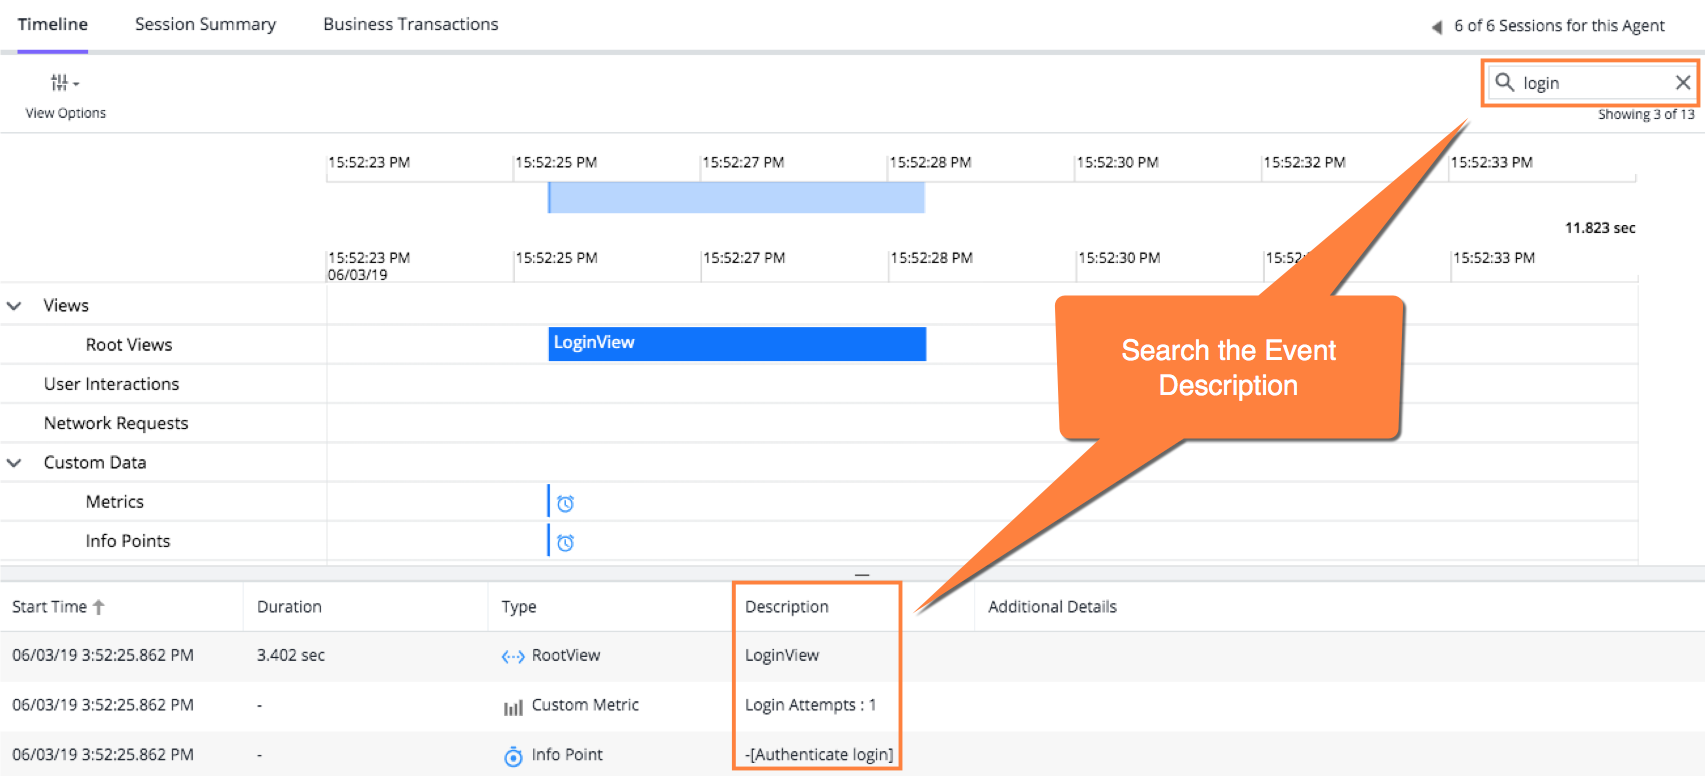
Search Events
You can search for a specific event Description using the search box located in the top right of the session timeline panel.
Session Summary
You can see a summary of the session by clicking Session Summary.

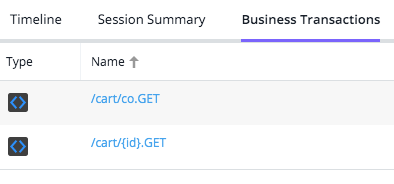
Business Transactions
You can see a list of business transactions in the session if applicable. This tab only appears if you have business transactions in the selected session.
Click the business transaction name to redirect to the transaction flow map.
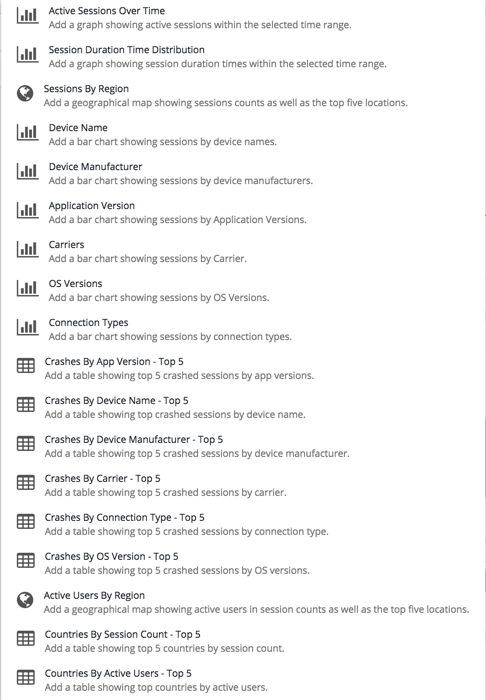
Charts
The Charts page provides you with a set of predefined widgets that offer visualizations of the data set you have created. As with the Charts pages of the other Analyze/Session features of the UI, you can delete, re-add, resize, and drag-and-drop to move all of the widgets.