AppDynamics offers two products to monitor browser applications:
- Browser Real User Monitoring (Browser RUM) - Monitors how your web application is performing, using real user data to analyze application performance and user experience.
- Browser Synthetic Monitoring - Analyzes application availability and performance, using scheduled testing to analyze website availability.
Overview of the Controller UI for Browser Monitoring
Browser RUM and Browser Synthetic Monitoring share two dashboards: Browser App Dashboard and Resource Performance Dashboard.
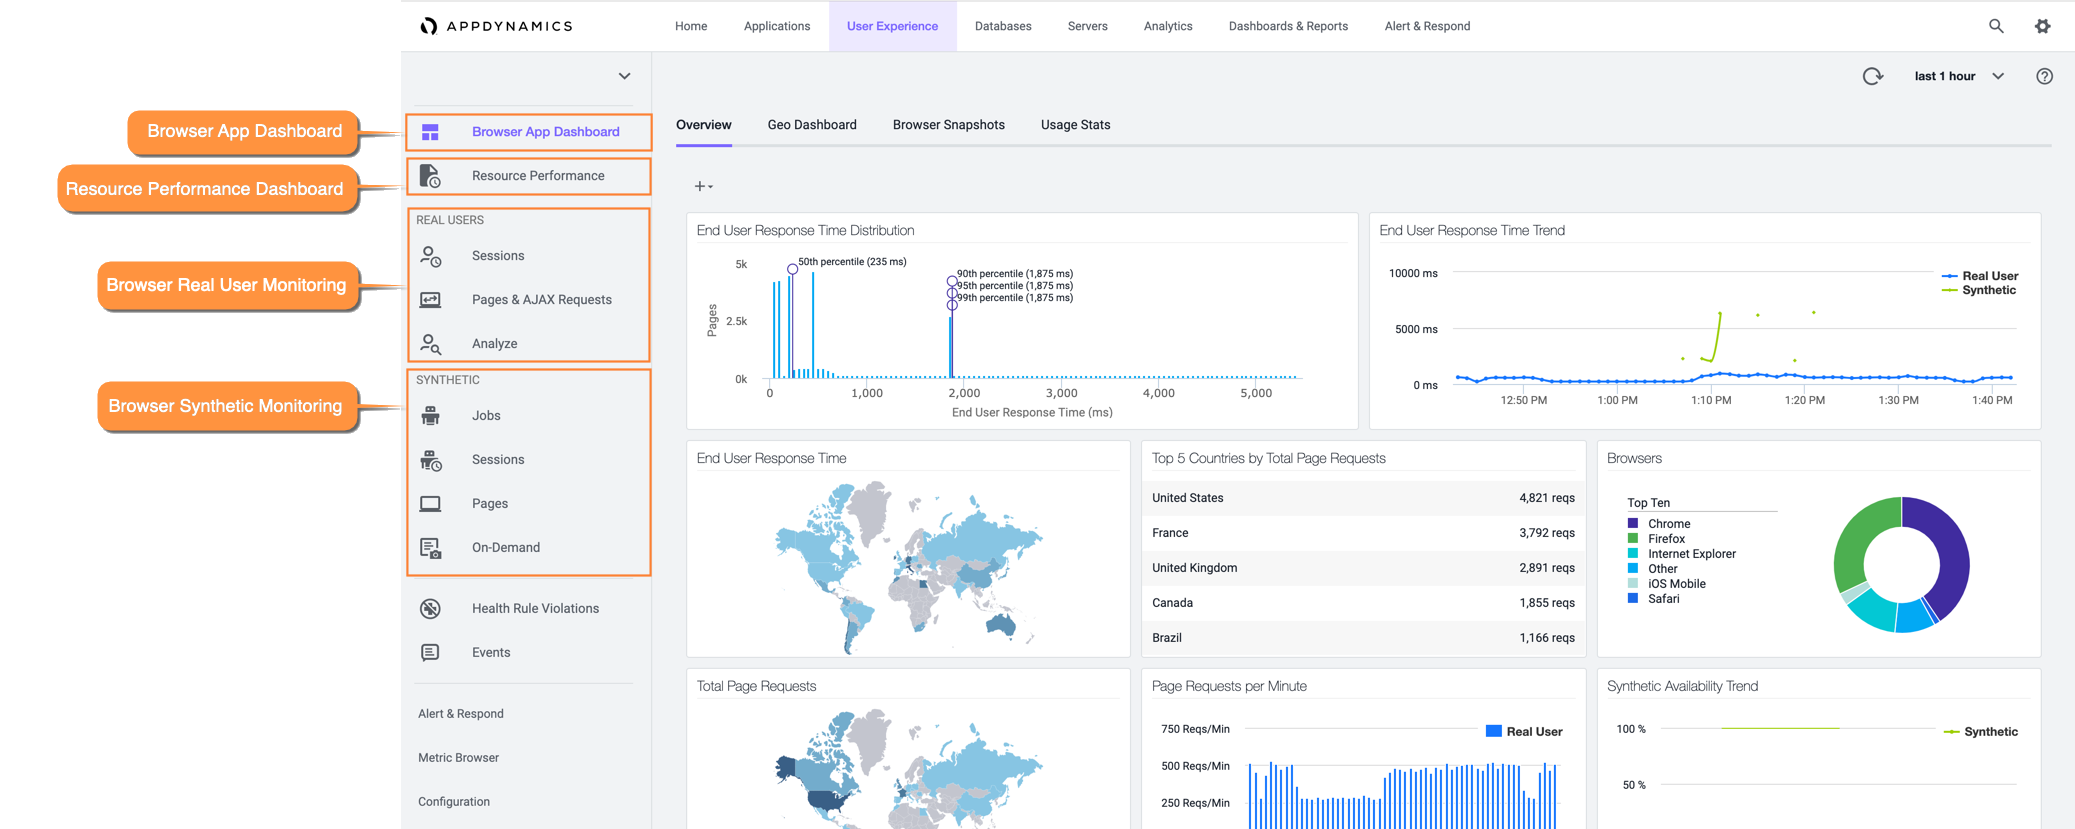
Browser App Dashboard
The Browser App Dashboard provides a high-level understanding of how your application's overall performance. When you first navigate to a browser application, you are defaulted to the Browser App Dashboard > Overview tab. The Overview tab contains widgets for both Browser and Synthetic data.
The Resource Performance Dashboard provides a high-level understanding of how your resources affect the performance of your browser application. You can use this dashboard to pinpoint resource-related performance issues affecting the user experience. You can toggle between viewing Browser and Synthetic data.
Real Users
Browser RUM contains these UI tabs for more detailed real-user data analysis:
Synthetic
Browser Synthetic Monitoring contains these UI tabs for more detailed synthetic user data analysis:
Differences Between Browser RUM and Browser Synthetic Monitoring
Although Browser Synthetic Monitoring and Browser RUM report similar metrics, there are differences in:
- Hardware
- Network connections
- Different browsers
- Browser caching is not present in synthetic sessions
If you see a sudden change in any of those metrics, you should compare the results of Browser Synthetic Monitoring and Browser RUM to determine if there is an existing problem.
Browser RUM excels at capturing the full breadth of performance and your real users' experience. Browser Synthetic Monitoring gives you confidence that your key workflows are always working and performing.
Synthetic Metrics and Screenshots
Browser Synthetic Monitoring can collect certain data that Browser RUM cannot. For example, Browser Synthetic Monitoring provides screenshots, which help you see per-page testing. You can also use the Visually Complete Time metric and other related metrics to understand how users experience page load time.
How to Use Browser RUM and Browser Synthetic Monitoring Together
Identify Issues
Although Browser RUM can detect certain kinds of problems (like JavaScript exceptions), it cannot comprehensively test for functional correctness. For example, you may want to verify that your online store has reasonable prices a list of items. If your site is down entirely, then the JavaScript Agent will never be loaded, so errors or verifications will not be reported. Fortunately, Browser Synthetic Monitoring will keep running, discover the error, alert you, and provide detailed information about the problem.
Control Environmental Factors
Hardware, browsers, operating systems, and networks complicate performance analysis in Browser RUM. Browser Synthetic Monitoring uses consistent hardware, software, and network configurations you set when you create a synthetic job, so if you see deviations in performance, you can be fairly certain a problem exists.