Download PDF
Download page Custom Match Rule Live Preview.
Custom Match Rule Live Preview
This page provides instructions and information for the custom transaction detection rule Live Preview.

Custom transaction detection rule Live Preview session lets you interactively preview the effect of rule updates on your business transactions. Live Preview also provides tools for the different rule types to let you inspect the live data streaming from your application.
When you launch Live Preview, select the node where you want to preview transactions. Nodes are organized by tier. You can see which nodes have active agents and if there is a live preview session already running on a node.
Preview Business Transactions
When you initiate a custom match rule live preview session, the Controller shows the rule configuration in the left pane. Click Preview Business Transactions in the right pane to see resulting transactions. You can edit the rule and click Apply to update the changes within the session.
When the agent discovers an entry point for a rule but the transaction payload contains correlation data from an existing transaction, Live Preview displays a masked transaction.
POJO Match Rule Tools
You can use these tools to inspect data and configure the entry point for a POJO custom match rule:
Classes/Methods browser—lets you search for classes.
You can right-click a class or method in the result to set the class and method match criteria for the POJO.
You can view method invocations for a selected method.
In live preview mode, the number of methods and classes that can be returned by an agent is now limit-bounded. The limits are:
- Maximum number of classes: 1000
- Maximum number of methods: 300
classmethodservice.max.no.of.classes.reported and classmethodservice.max.no.of.methods.reported, respectively
- Method Invocations—lets you inspect live data from the server for the specified method.
- Expand a method invocation to see detailed information including invoked objects, parameters, and return values.
- Right-click on a data point to use it in transaction splitting.
AppDynamics automatically creates a splitting rule following theget<field>()syntax.
If your code follows another convention, you need to manually specify the getter method for the data point. - You can also copy a getter chain to the clipboard.
The example below shows the data for a method,Order.setQuantity():
Servlet Match Rule Tools
When you use Live Preview to inspect data for a servlet custom match rule, AppDynamics shows live HTTP Requests that meet the rule criteria. You can click an individual Request URL to view detailed request data: headers, cookies, and parameters.
- Right-click an individual data point, such as a header, to add the value to the match criteria or to set it as a transaction splitting option.
- You can group the incoming HTTP requests by various parts of the request and its payload, such as the URI, an HTTP parameter, a header, etc. You can right-click a result from the Values column and add the value to the HTTP Request Match criteria.
Masked Transactions
Live Preview flags transactions that are downstream from another existing business transaction as masked transactions. To view the originating business transactions masking the current transaction, click the link indicating the number of transactions.
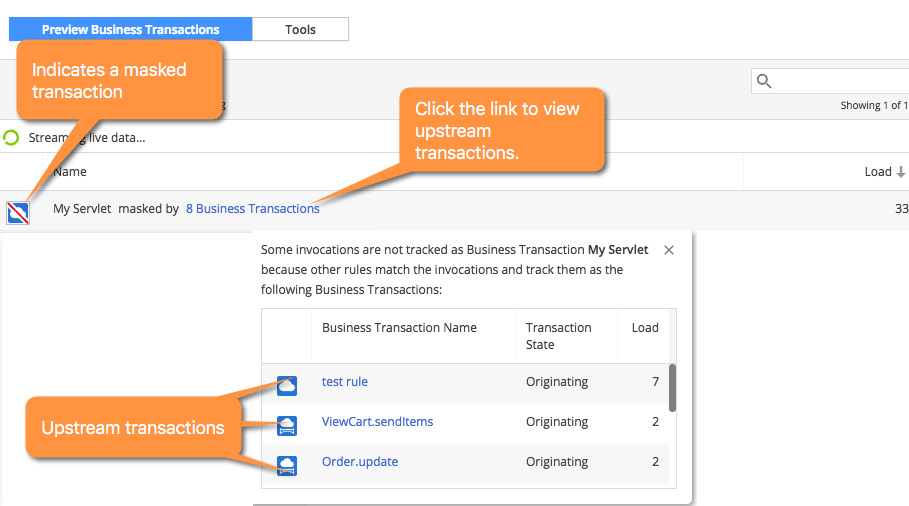
Click a business transaction name to view the business transaction dashboard for the masking transaction.
If you want to view metrics for the current entry point outside of a masking transaction or transactions, you can either:
- Deactivate the business transaction detection rules that created the upstream transactions, or
- Create a service endpoint for the entry point.
Otherwise, you can continue to track the performance of the masked entry point as a segment of the business transaction it currently belongs to.