Download PDF
Download page Experience Journey Map.
Experience Journey Map
Experience Journey Map visualizes:
- Performance metrics for each step in a user journey
- Performance metrics from one step to the next
- Top incoming and outgoing traffic data for each step
- Drop-off rates
- Refresh traffic and performance data
Requirements
- SaaS: Controller 20.6.0+
- On-premise: Controller 20.7.0+
- EUM Peak license (RUM Peak, Browser RUM Peak, or Mobile RUM Peak)
- Instrumented browser or mobile application
Access Experience Journey Map
To access Experience Journey Map:
- Under the User Experience tab, go to a browser or mobile app.
- In the left application panel, click Experience Journey Map.
Overview of the Experience Journey Map UI
The sections below provide an overview of the Experience Journey Map UI. In the Controller, click on the Legend![]() for key terms.
for key terms.
Experience Journey Map Dashboard
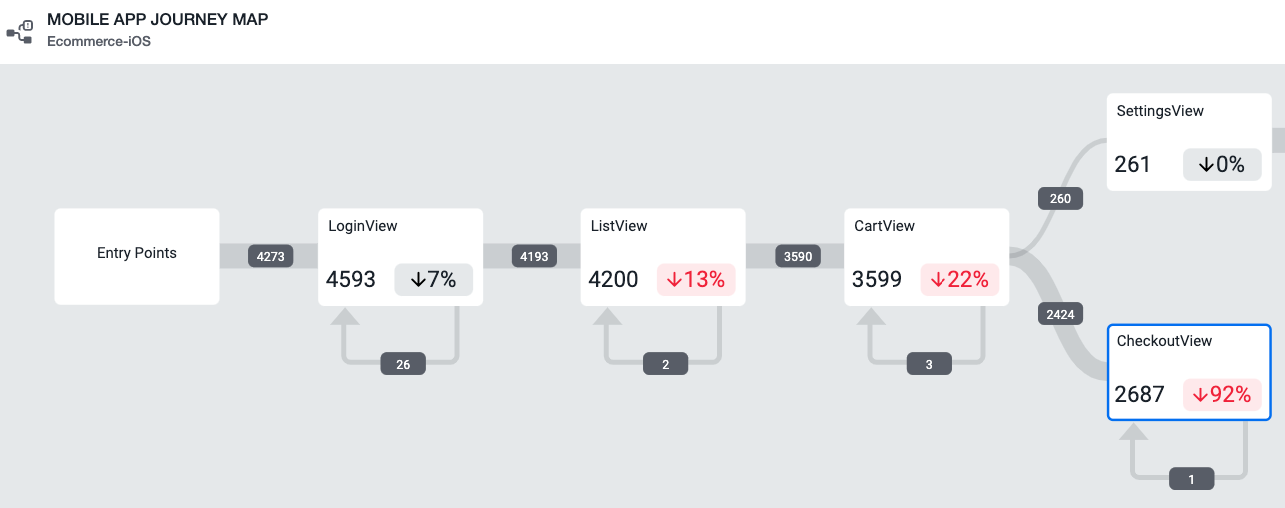
The Experience Journey Map dashboard displays the top user journeys, or the most trafficked parts of an app. The default time frame is set to one hour, but you can adjust the time and the dashboard automatically updates the user journeys and data for that time frame.
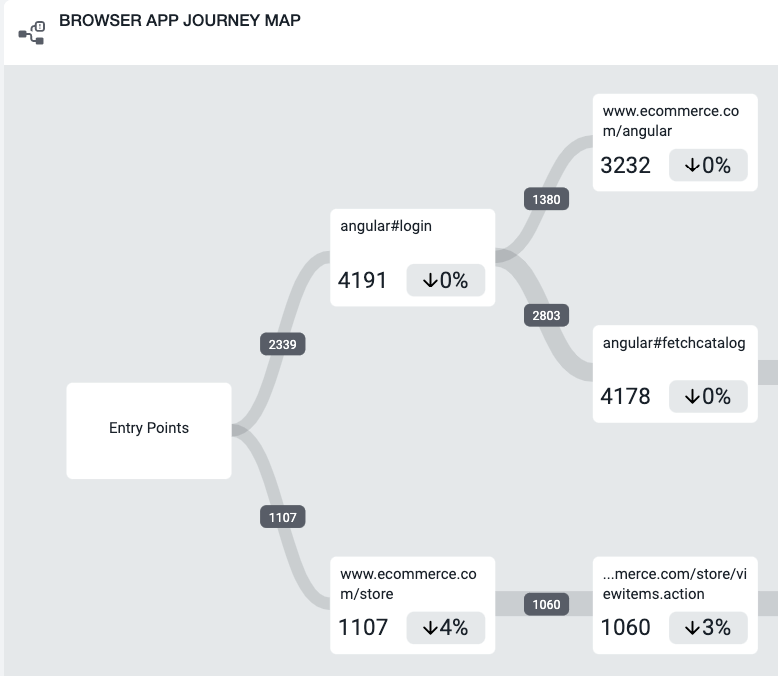
End User Events
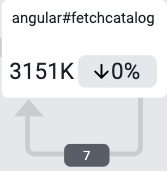
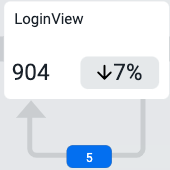
Each step in a user journey is visualized with an end user event. An end user event is a browser page or mobile view/activity. Experience Journey Map displays the most trafficked end user events.
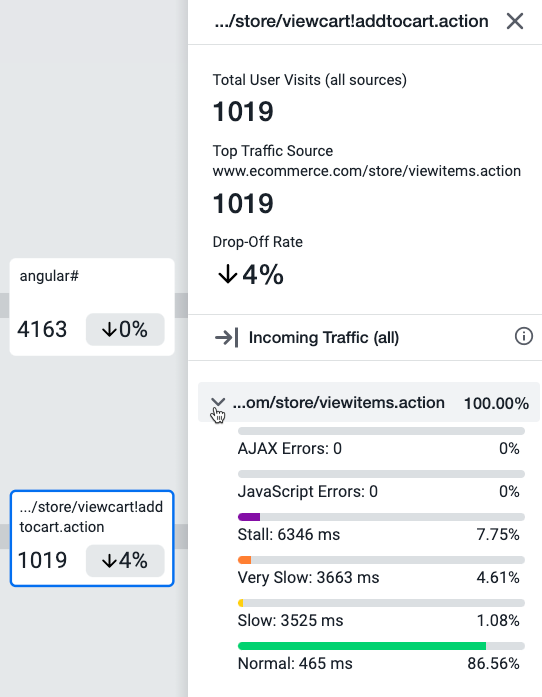
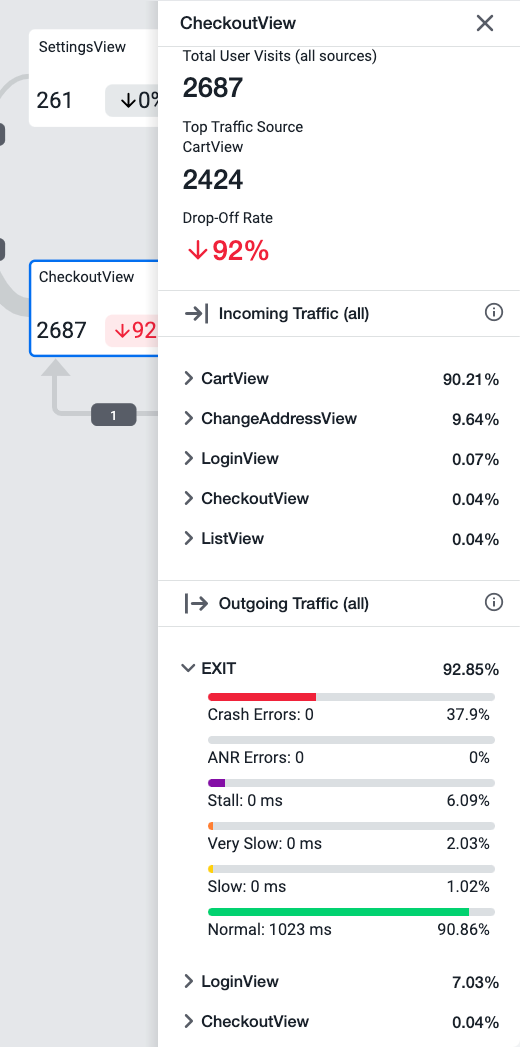
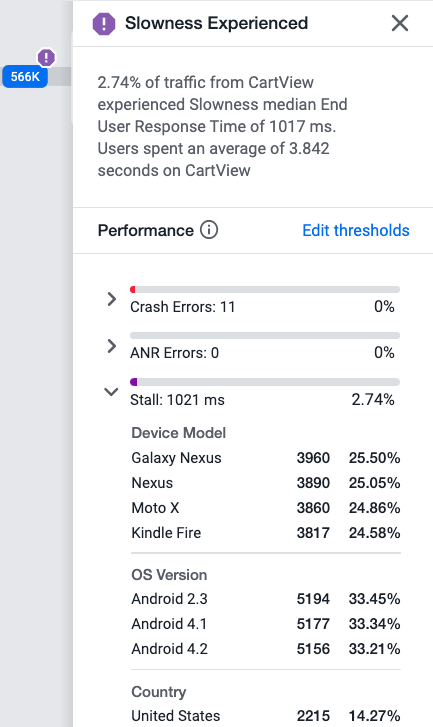
Click an end user event to see:
- total user visits from all sources
- incoming and outgoing traffic sources
- performance breakdowns for each traffic source
- drop-off rate
Traffic Segments
A traffic segment connects two end user events and contains data about users who journeyed from one end user event to the next. Traffic segments display a health status icon for errors and exceeded performance thresholds. To edit performance thresholds, see Configure Experience Journey Map.
Click a traffic segment to see:
- number of users who came from the previously mapped end user event
- performance metrics for those users
- option to analyze individual browser or mobile sessions for that end user event

Refresh Loops
A refresh loop is a type of traffic segment and contains data for users who refresh an end user event.
Click a refresh loop to see:
- number of users who refreshed the end user event
- performance metrics for those users
- option to analyze browser or mobile sessions for that end user event
Browser vs. Mobile Apps
The table below describes the differences in Experience Journey Map data for browser vs. mobile apps.
| Difference | Browser Apps | Mobile Apps |
|---|---|---|
| End User Event | An end user event shows data for one browser page. To customize end user event names, see Configure Page Identification and Naming. | An end user event shows data for one iOS view or Android activity. To customize how the mobile agent reports the view/activity names via the |
| Default performance threshold metric | Performance thresholds (Slow, Very Slow, Stall, and Normal) are set to End User Response Time (EURT), or page load time. | Performance thresholds (Slow, Very Slow, Stall, and Normal) are set to the average time of mobile network requests. |
| Types of errors captured | JavaScript and AJAX errors. | Crashes and Application Not Responding (ANRs). |
| Analyze functionality | When you click Analyze, you are redirected to Browser RUM Analyze with filters applied for that mapped browser page. | When you click Analyze, you are redirected to Mobile Sessions with filters applied for that mapped mobile view/activity. |
| Misc. | Iframes are captured and included as a node with performance metrics, such as for SPA2 base pages. | You may notice that sometimes the metric breakdowns of performance thresholds do not add up to 100%. See Analyze User Journeys for an example. This is because for mobile apps, performance thresholds are set to an average of only the network request(s) triggered from a view/activity. If the number of triggered network requests is less than the number of total network requests, the performance threshold breakdown does not add up to 100%. |