Ajax request snapshots give you a detailed look at an individual Ajax request. The Summary tab of the snapshot describes the general characteristics of the page.

Waterfall Graph

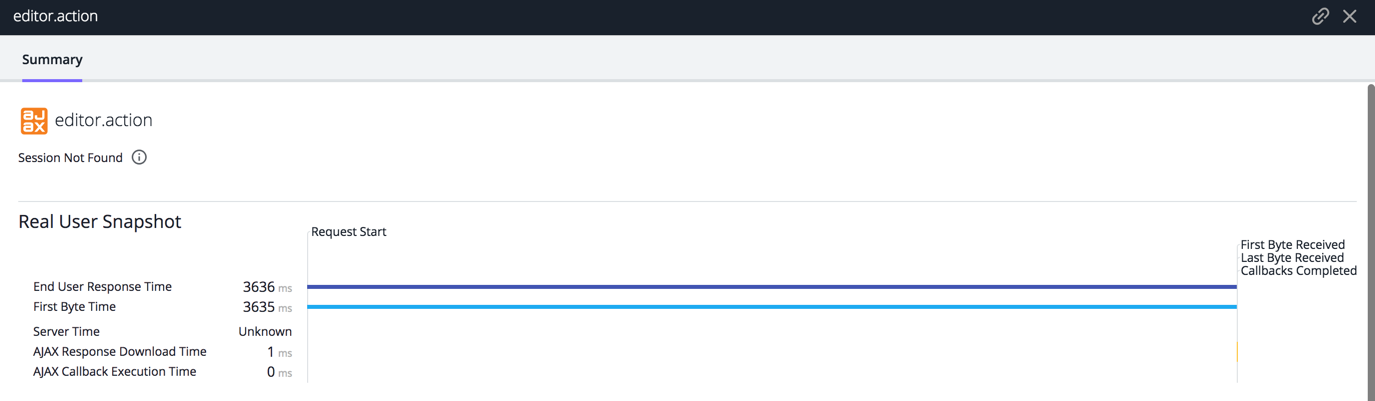
The top of the Ajax snapshot displays a waterfall graph of the overall transaction timing for the Ajax request. The snapshot is labeled either a Real User Snapshot or a Synthetic Snapshot based on the origin of the request. You can hover over each of the metrics to see a popup definition for that metric.

Real User Snapshot

For a detailed description of what these metrics mean, see Browser RUM Metrics.

Details

Much of the information is the same as you see for page snapshots. The main differences are:

  • If there is an Ajax error, the error code returned with it is listed.
  • The parent page from which the Ajax call originates is listed.

You can configure errors to ignore if you are seeing too many errors that are not of interest. See Configure JavaScript and Ajax Error Detection.