Download PDF
Download page Configure JMX Metrics from MBeans.
Configure JMX Metrics from MBeans
Related pages:
This page describes how to create persistent JMX metrics from MBean attributes. See Monitor JMX.
There are many helpful JMX topics on the AppDynamics community to help you with platform-specific troubleshooting tips.
JMX Metric Rules and Metrics
You can add persistent JMX-based metrics to AppDynamics using metric rules. Once you create a persistent JMX metric, you can:
- View it in the Metric Browser.
- Add it to a Custom Dashboard.
- Create a health rule for it so that you can receive alerts.
You can use the MBean Browser or JMX Metrics Rules Panel to create new metrics. MBean query expressions are supported.

Access the MBean Browser
If the MBean is already monitored and you want to create a metric from one of its attributes, you can do so from the MBean Browser.
To create a metric from an existing MBean attribute:
- Open the Node Dashboard of the node that hosts the MBean, and navigate to MBean Browser > JMX.
- Expand the domains listed in the left panel and select the MBean that contains the attribute of interest.
- Expand the Attributes section, select the attribute, and click Create Metric.
Configure JMX Metric Rules
- Navigate to Configuration > Instrumentation > JMX to add an MBean and attributes, possibly based on complex matching patterns.
- From the JMX Metric Configurations panel, click the Java platform to add the metric to a platform group.
- Alternatively, create a new group and add your metric to the group.
Groups allow you to organize metrics to meet your needs. For example, you may choose to keep custom metrics with their Java platform, or put all metrics you add into a Custom group to differentiate them from out-of-the-box metrics.
JMX Metric Settings
The general settings for adding instrumentation for an MBean are:
- The Name is the identifier you want to display in the UI for the MBean.
- An Exclude Rule excludes matched MBeans that would otherwise be included by other rules. See Exclude MBean Attributes.
- Enabled means that you want this rule to be applied.
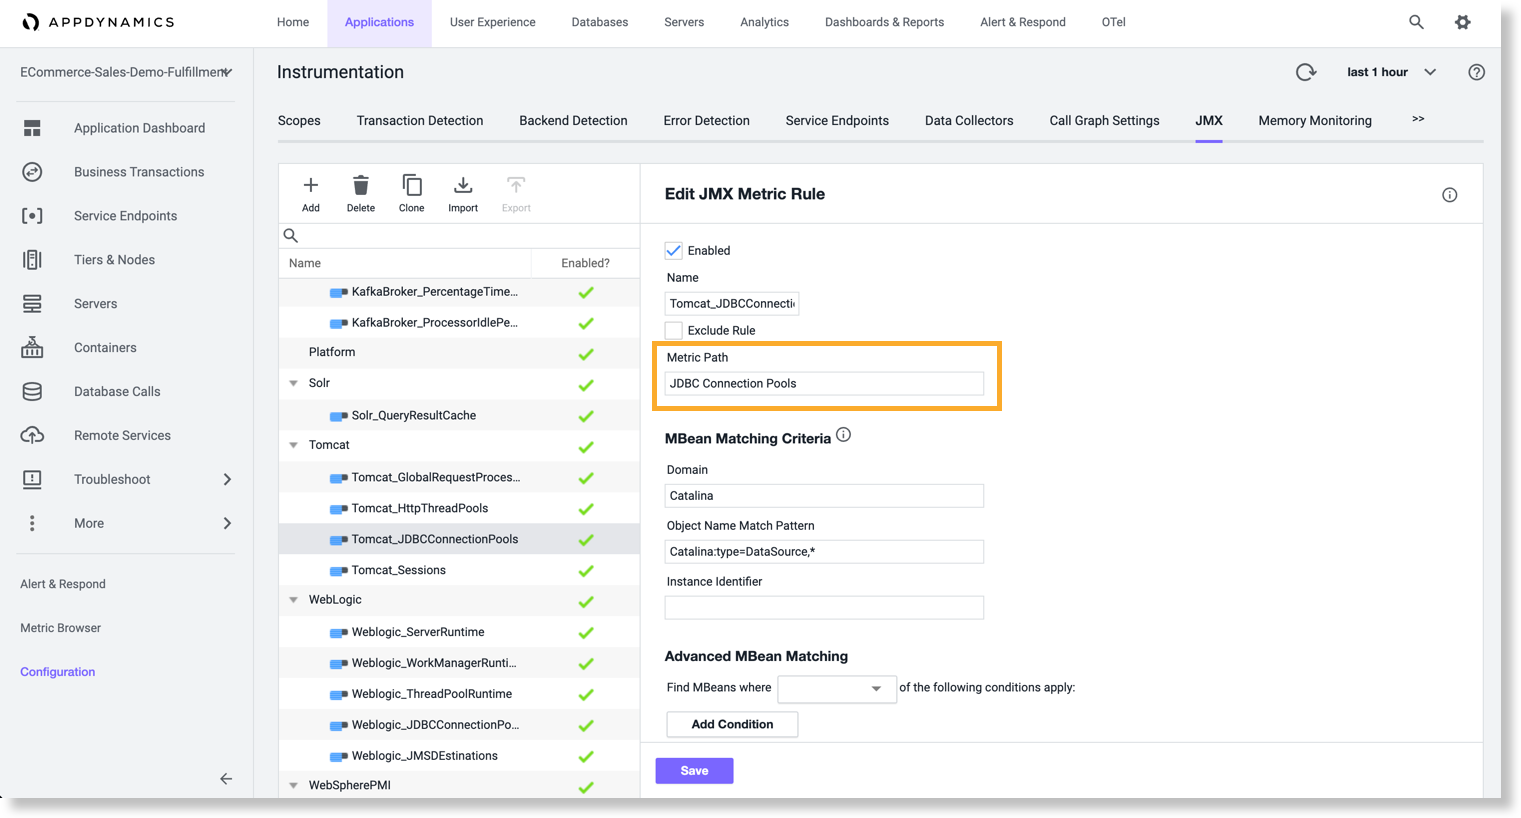
- The Metric Path determines where the metric appears in the metric browser.
For example, in the screenshot below, the metric path is "JDBC Connection Pools" for JMX metric "Tomcat_JDBCConnectionPools".
Make sure that you do not use the full path in Metric Path. For example, use
Web Container Runtimeinstead ofApplication Infrastructure Performance|account-services|JMX|Web Container Runtime.
In the MBeans subpanel, add matching criteria to identify the MBeans that you want to monitor.
- The Domain name is the Java domain. This property must be the exact name; no wildcard characters are supported.
- The Object Name Match Pattern is the full object name pattern. The property may contain wildcard characters, such as the asterisk for matching all the name/value pairs. For example, specifying
jmx:type=Hello,*matches a JMX MBean ObjectName, jmx:type=Hello,name=hello1,key1=value1. - The Instance Identifier is the MBean ID.
Instance Identifier is a field in the JMX Object pattern that can be used to categorize the runtime context of MBean category that has the same set of attributes. For example, the user category has two HTTP ports: 8090 and 8181. But attributes such ascurrentThreadsBusyandmaxThreadsare the same. If a JMX pattern has both HTTP and AJP, but the user is interested in monitoring only HTTP and not AJP thread pool, then the user uses an identifier, a name that matches HTTP so that only HTTP ports related MBean data is collected. - Advanced MBean Matching Criteria is an optional control for matching against attribute values. Identify the attribute name and value to test, along with matching criteria, such as a substring match.
Without any instance identifier specified, a tree of resources or attributes is shown on the JMX Metric browser that matches the Object Name Match Pattern.
For example:
JMX --> ConnectionPoolModules ConnectionPoolA
PoolSize ConnectionPoolB
PoolSize
If you specify an instanceIdentifier like instance identifier = path2, it will show the second level attributes on the top level also.
The above tree will be shown as in the following example. The PoolSize, which is in the second level, also appears in the top level.
JMX --> ConnectionPoolModules PoolSize
ConnectionPoolA
PoolSize ConnectionPoolB
PoolSize
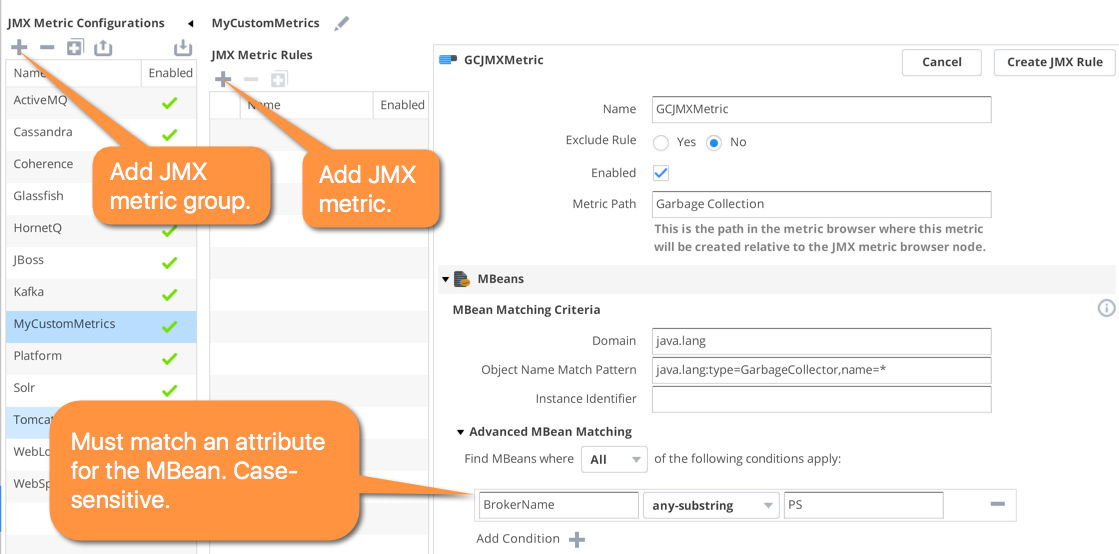
For example, this screenshot displays the MBean matching criteria for the GCJMXMetric rule.

For all matched MBeans, you can define one or more metrics for the attributes of those MBeans:
- Metric Getter Chain—Expressions can be executed against any value. In addition, getter chains for Strings and Booleans are supported using implicit conversion. See MBean Getter Chains.
- Metric Time Rollup—Determines how the metric will be aggregated over a period of time. You can choose to either average or sum the data points, or use the latest data point in the time interval.
- Metric Cluster Rollup—Defines how the metric will be aggregated for a tier, using the performance data for all the nodes in that tier. You can either average or sum the data.
- Metric Aggregator Rollup—Defines how the Agent rolls up multiple individual measurements (observations) into the observation that it reports once a one minute. For performance reasons, Agents report data to the Controller at one-minute intervals. Some metrics, such as Average Response Time, are measured (observed) many times in a minute. The Metric Aggregator Rollup setting determines how the Agent aggregates these metrics. You can average or sum observations on the data points or use the current observation. Alternatively, you can use the delta between the current and previous observation.
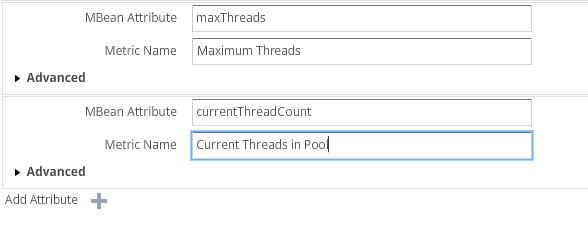
For example, the maxThreads MBean attribute is mapped to the Maximum Threads metric in the JMX metrics browser as shown here:

Export and Import JMX Configuration
After you modify the JMX configuration, you can backup or transfer the configuration using the JMX Configurations export and import icons at the top of the JMX Metric Configuration panel on the JMX instrumentation page. The configuration exports as an XML file.
Deactivate Transaction Monitoring for JMX Monitored Nodes
In some circumstances, such as for monitoring caches and message buses, you want to collect JMX metrics without the overhead of transaction monitoring.
You can do so by turning off transaction detection at the entry point. See Transaction Detection Rules.
MBean Getter Chains
Getter chains in custom MBean configuration specify the method that retrieves the value of interest.
Expressions can be executed against any value. In addition to getter chain support for numeric boxed primitives (Short, Integer, Long, and so on), Strings and Booleans are supported using implicit conversion.
Boolean and String are implicitly converted to an Integer:
- Booleans are automatically converted to 0 (false) and 1 (true).
- Strings are converted to numeric values.
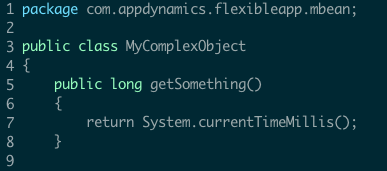
This example illustrates how to use a getter chain, given the class with a getSomething() method that returns the time:

In this example the metric getter chain configuration would be:
