Download PDF
Download page Overview of the Controller UI for Browser RUM.
Overview of the Controller UI for Browser RUM
Browser RUM presents information in these views:
- An Overview dashboard, with sections for:
- widgets for graphic display of common metrics
- map-based performance display
- snapshots of individual requests
- usage statistics by browser and device/platform
- Unified data for entire sessions, following an individual user's path as they navigate through your site
- Detailed information on the performance of individual pages, as
- aggregated lists of page, Ajax, iframe, and virtual page request types
- multi-faceted data from a complete data store
Access a Browser RUM Application
To see the data for your app in the Controller UI, you must first open your application:
- In the top tab bar, select User Experience. The list of instrumented Browser and Mobile Apps is displayed.
- Make sure the Browser App tab is selected.
- Double-click on the app you are interested in. The monitoring UI opens.
Browser App Dashboard
This view is good for getting a high-level understanding of how your app is performing overall.
Overview
The Overview tab is made up of a set of widgets showing common usage metrics. You can add, delete, move, and resize widgets as you wish. If you see a metric that interests you, click through to the main view. If you are using Synthetic, data from both RUM and Synthetic (separated by color) show up in some of the widgets.

For more information, see Browser App Dashboard.
Browser App Geo Dashboard
The Geo Dashboard view provides high-level insight into how your application is performing across the world for your users. The size of a dot indicates the number of page views from that region, and the color indicates the average page load End User Response time in that region (red is slow). You can click to drill down to areas of specific interest. You can also see the same information presented in tabular form by clicking the grid icon in the upper left of the panel.
If you are using Synthetic, you can also select to see either RUM or Synthetic data displayed here. By default, the Geo Dashboard displays key performance metrics by country, but you can view performance metrics by region by checking the Show regions in Global View.

For more information, see Browser App Dashboard.
The option View Dark Mode has been removed from the Geo Dashboard.
Browser Snapshots
The Browser Snapshot view provides access to detailed information for individual requests. The list includes both periodic snapshots of requests operating within normal boundaries and problem snapshots of requests that have exceeded one or more configurable performance criteria. Double-clicking a specific item takes you to a detailed graphical representation of the execution flow of that request and other data associated with it.

For more information, see Browser Snapshots.
Usage Stats
The Usage Stats view presents aggregated page load usage data based on the browser type and device/platform employed by your users. The view also breaks down performance by type and usage by country.

For more information, see Browser App Dashboard.
Sessions
In most cases, users interact with your web application over a series of real (or virtual) pages. Sessions allow you to track your users' interactions across time, as they navigate through an entire engagement period with your app. Using Browser RUM Sessions, you can analyze session results from all requests, as stored in the AppDynamics Events Service. Use the Records tab to focus on pertinent data and the Charts tab to view a dashboard of useful graphics widgets. Or follow a session from page to page using the Session Detail dialog.

For more information, see Browser RUM Sessions.
Pages & Ajax Requests
This view is good for tracking the performance of individual pages and components as well as understanding any issues that may be emerging. The Pages & Ajax Requests view shows you an aggregated view of how each of your page, Ajax request, iframe, and virtual page types are performing over time. You can look at All Pages for an overall sense or select a Top Pages view to see the worst performing pages sorted by common metrics like Page views with JavaScript Errors and First Byte Time. And you can drill down to a graphical dashboard showing a wide range of charted performances characteristics for any specific request type.

For more information, see The Pages & Ajax Requests View.
Analyze
The Analyze view allows you to query a complete repository of all traffic data that Browser RUM has collected in the past two weeks and display that data in multiple ways.
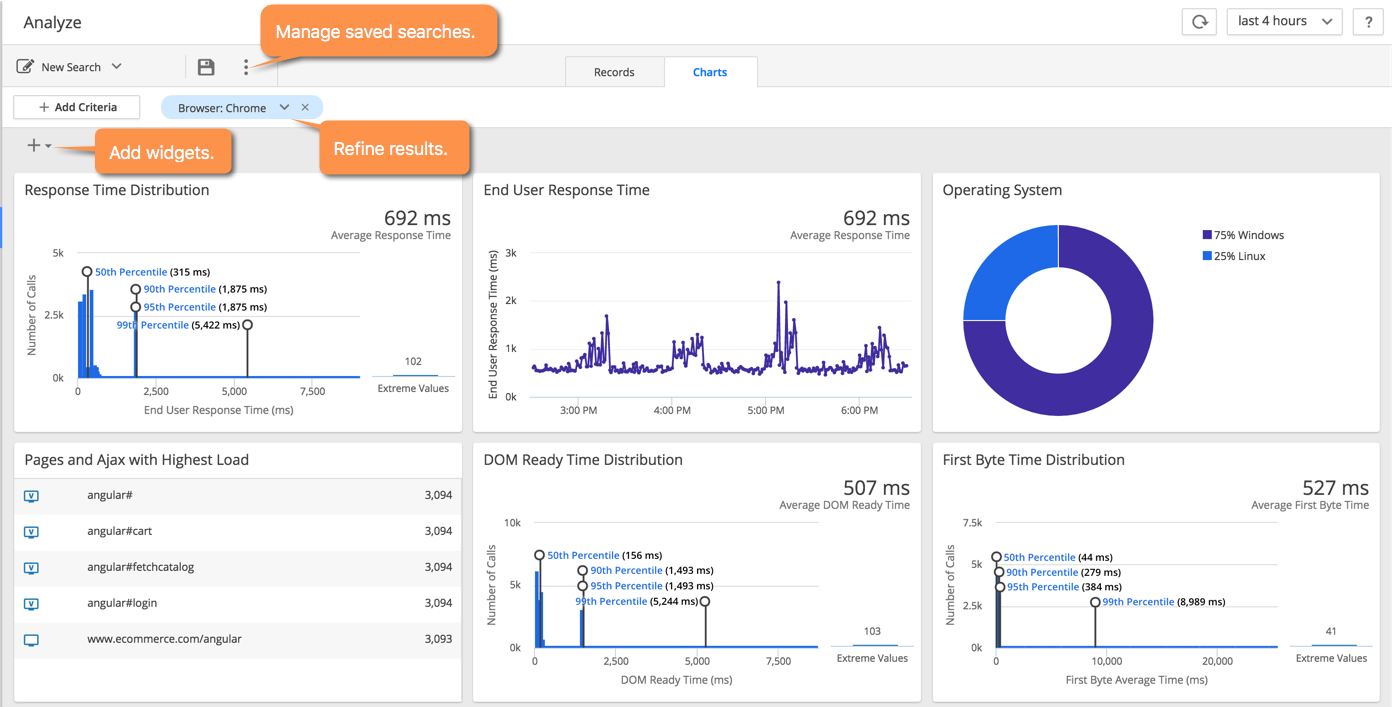
For more information, see Browser RUM Analyze
Enable Browser RUM
Browser RUM requires a separate license and must be enabled before it is available for use.
For information about licensing, see EUM Accounts, Licenses, and App Keys.
For information on enabling or disabling Web User Experience, see Set Up and Access Browser RUM.