Database Visibility provides metrics on the performance of your database and helps troubleshoot performance-related issues.
Components of Database Visibility
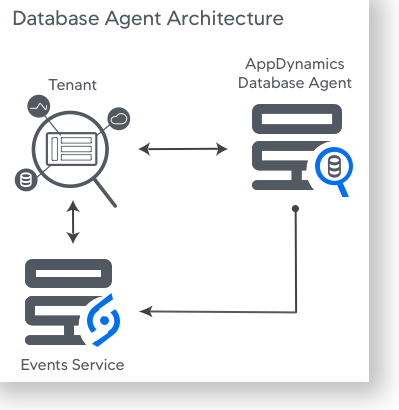
AppDynamics Database Visibility consists of four main components:
- Database Agent
- Collector
- Controller
- Events Service
Database Agent
The AppDynamics Database Agent is a standalone Java program that collects performance metrics about your database instances and database servers. You can deploy the Database Agent on any machine running Java 1.8 or higher. The machine must have network access to the AppDynamics Controller and the database instance that you want to be monitored.
A database agent running on a typical machine with 16 GB of memory can monitor about 25 databases. On larger machines, a database agent can monitor up to 200 databases. To monitor more than 100 databases, increase the initially allocated heap size for the Database Agent JVM. See Database Visibility Supported Environments
Collector
The Database Agent Collector is the process that runs within the Database Agent to collect performance metrics about your database instances and database servers. One collector collects metrics for one database instance. Multiple collectors can run in one Database Agent.
AppDynamics Database Visibility detects when a database back end has matching credentials with a database server being monitored by a collector. Database Visibility automatically associates the back end with the collector, so you can view its performance with the Application Flow Map, Tier Flow Map, or Node Flow Map.
Controller
The Controller is the central interface where you can see all your database instances and database server performance metrics.
The following types of information are sent to the Controller:
- Database-level metrics, such as the number of queries processed and other database statistics.
- Names and attributes of all sessions, clients, queries, and other objects on the monitored system.
Events Service
Event service stores high volumes of metric data.
The following types of information are sent to the Events Service:
- The time that each query spends at each wait state.
- Individual query statistics for databases that support it.
- Information about individual execution plans in databases that support it.