Sometimes environmental conditions cause trouble on the machines where your application runs. Issues that occur outside monitored application code don't show up on transaction snapshots. Machine snapshots provide critical details about CPU usage, memory usage, and the IIS queue on a server at a specific moment in time. Use the data in machine snapshots to uncover and resolve environmental problems.
AppDynamics generates machine snapshots to capture the state of a server at a specific moment in time. The machine snapshots show the processes running on the machine, the IIS application pool activity, and any related transaction snapshots. By default the .NET Machine Agent takes machine snapshots under these conditions:
- Periodic collection: The agent takes one snapshot every 10 minutes.
- Breached thresholds: The .NET Machine Agent takes samples of machine statistics every 10 seconds within a 10-minute window. For each sample, the agent checks the CPU percent usage, the memory percent usage, and the oldest item in the IIS application pool queue. The agent flags a sample as a violation when the current usage meets or exceeds one of these thresholds:
CPU at 80% or higher
Memory at 80% or higher
- IIS application pool queue item older than 100 milliseconds
The agent takes a snapshot when it identifies 6 violations of a single type, such as CPU usage, within the window. The agent only takes one snapshot per window for breached thresholds.
To customize the periodic collection or threshold settings, see Configure Machine Snapshots for .NET.
Before Starting
The .NET Machine Agent requires >= IIS 7 to return machine snapshot data for IIS application pools. Additionally, you must enable the Request Monitor for the IIS Health Monitoring feature.
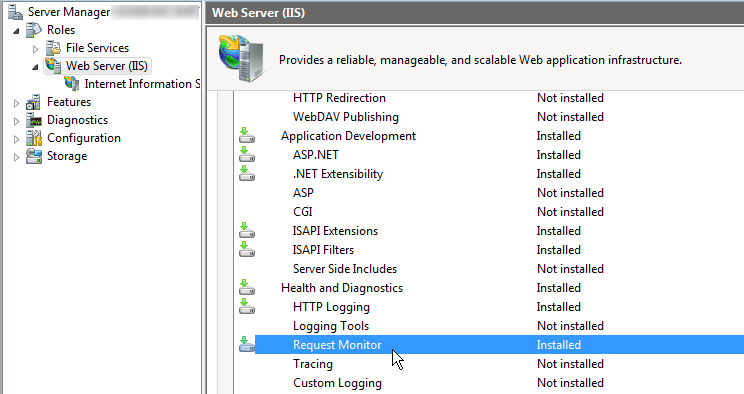
To enable Request Monitor from the Windows PowerShell command line, launch PowerShell as an administrator and run this command:
Install-WindowsFeature Web-Request-Monitor
CODE
Work With Machine Snapshots
The Machine Snapshot tab on the Application dashboard lists all the snapshots for the selected time range. Entries for individual snapshots show:
- Time the .NET Machine Agent took the snapshot
- Machine name for the snapshot
- Snapshot trigger, either periodic snapshot collection or threshold exceeded
- Percent CPU usage
- Percent memory usage
Use Filters to limit the snapshot list to a specific snapshot trigger:
- Periodic collection
- Memory events
- CPU events
- IIS events
- Machines where the agent took snapshots
- Archived snapshots
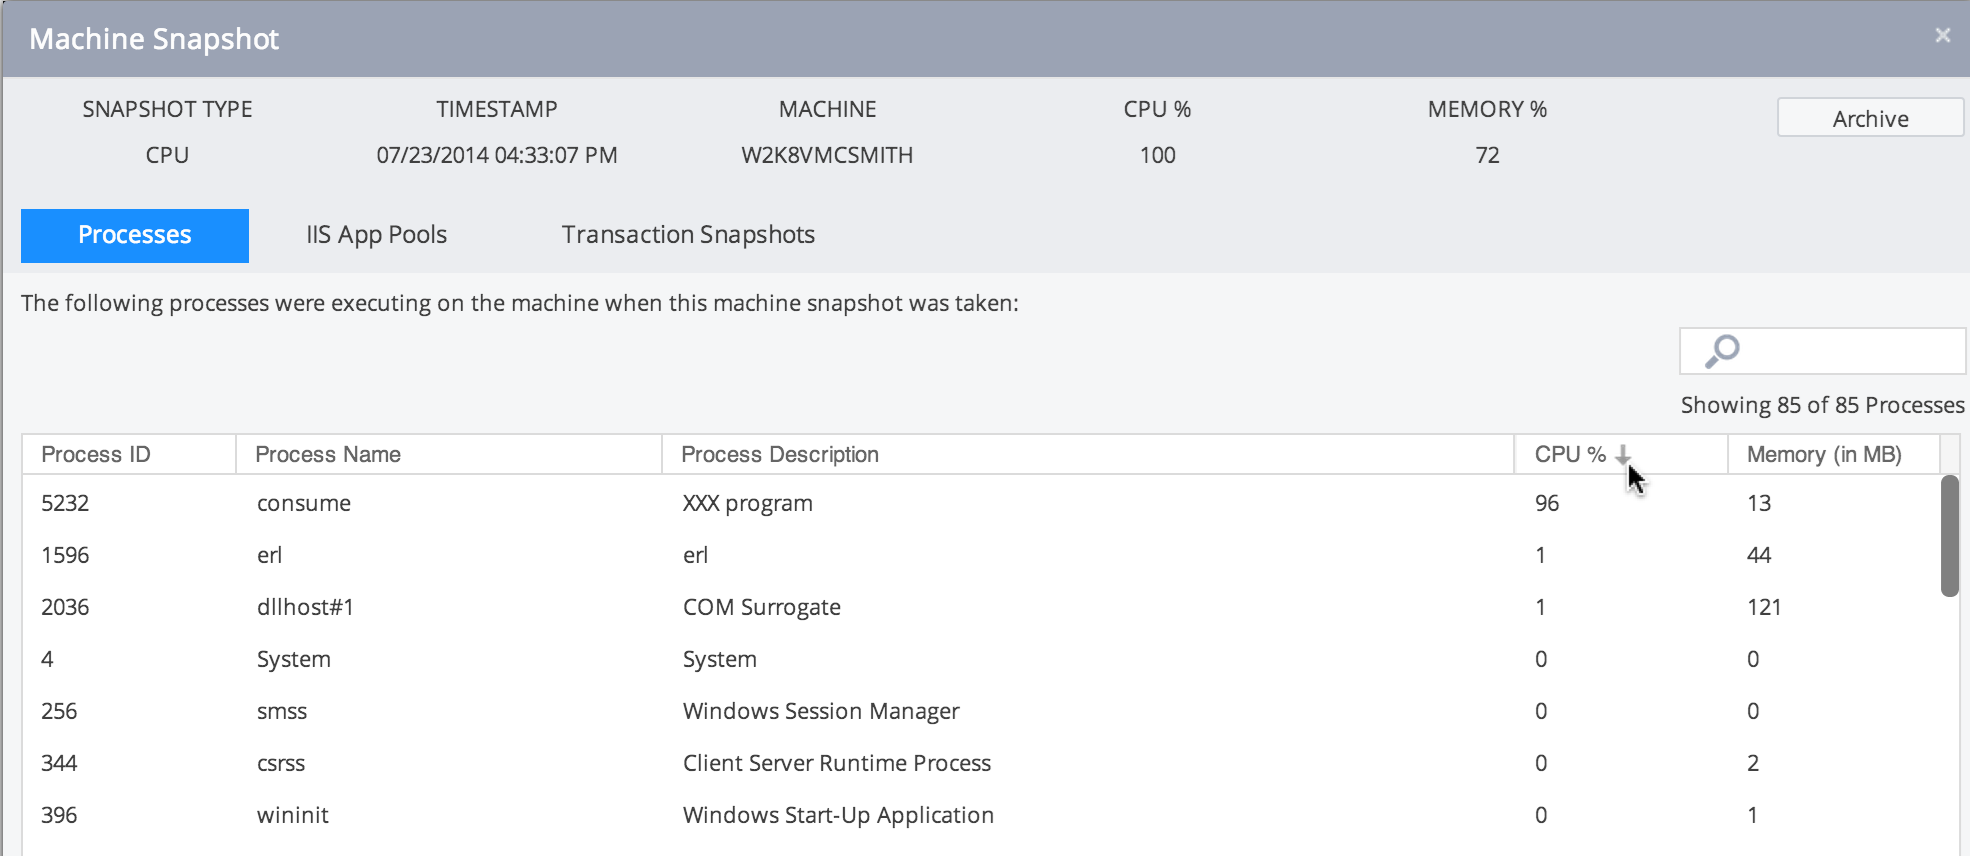
Double-click a snapshot to open the Machine Snapshot panel:
- The Processes tab shows information similar to that from the Windows Task Manager, including:
- Process ID
- Process name
- Process description
- Percent CPU used by the process
- Percent memory used by the process
Click a column heading to sort by the column. For example, click CPU % and sort descending to identify processes using the most CPU.
- The IIS App Pools tab shows information on the active IIS application pools:
- The Transaction Snapshots tab displays all transaction snapshots involving the current machine for five minutes prior to and five minutes after the machine snapshot. This demonstrates how current environmental factors are affecting your business transaction performance. For example, when CPU usage is high, you may discover slow and stalled transactions. Double-click a transaction snapshot to open it.