Download PDF
Download page Workflows and Example Use Cases.
Workflows and Example Use Cases
Network Visibility makes it easy to answer the question: Is the network impacting my application's performance? This page describes the high-level troubleshooting workflows and includes several examples of how to use these workflows to solve real-world network problems.
Application Troubleshooting
From the Application Dashboard and I see slow, very slow, error, or stalled transactions. Are network conditions to blame?
- Application Dashboard: Are network conditions to blame for the issue?
- Network Dashboard: Which network tiers and links are associated with these network conditions?
- Tier Dashboard: Which network metrics on this tier correlate with my outlier transactions?
- Network Dashboard (Advanced Diagnosis): On which TCP connections are these network issues occurring?
Application Dashboard: Are network conditions to blame for the issue?
Network Agents collect network-performance metrics for each application tier. If you notice performance issues in the Application Flow Map, open a popup and click Network tab. Do you see correlations between the Response Time and the other charts? If so, it indicates that the Response Time is affected by:
- TCP effects between the two tiers (Latency)
- Performance Impacting Events at the client tier, server tier, or the network path between the tiers (PIE)
- Errors setting up or tearing down TCP connections (Errors)

Network Dashboard: Which network tiers and links are associated with these network conditions?
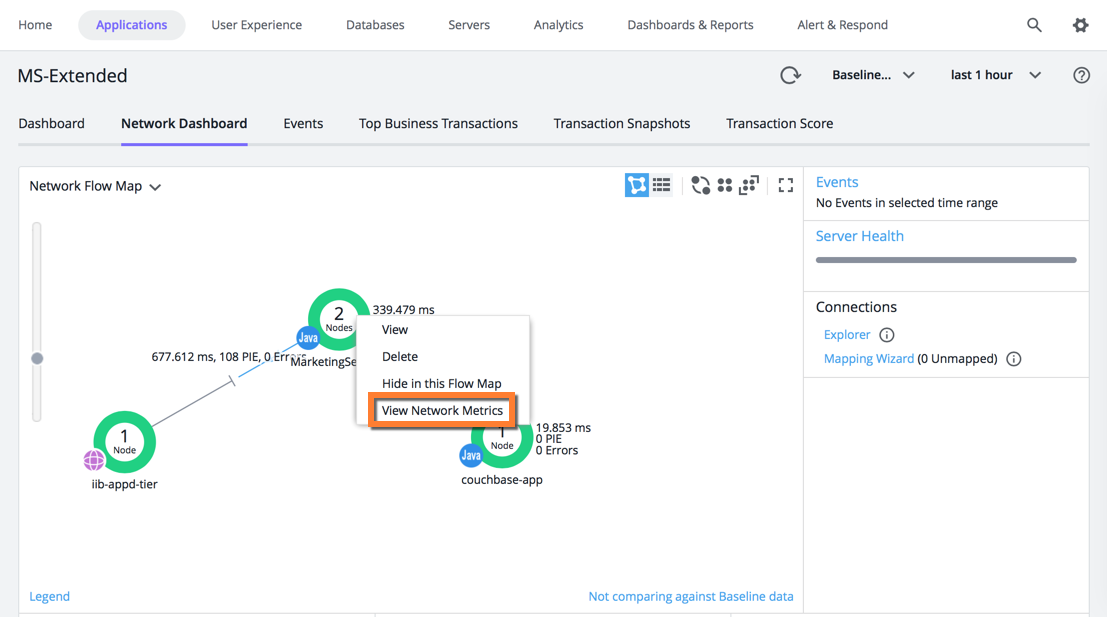
Go to the Network Dashboard, which shows the TCP and network context for the application. Each tier and link has a View Metrics right-click option that opens a context-sensitive dashboard. The dashboard charts make it easy to determine network root causes. Start from the top-left chart in each dashboard, then search for metric correlations in the other charts.
Tier Dashboard: Which network metrics on this tier correlate with my outlier transactions?
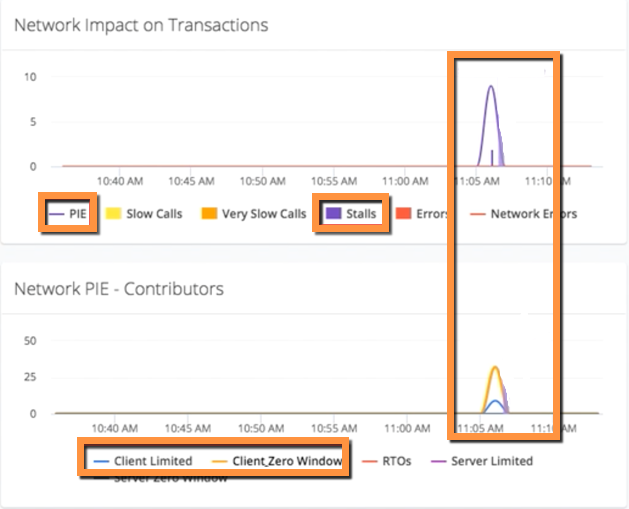
The link and tier dashboards both have a Network Pie - Contributors chart, which answers the question: Where are these network conditions occurring – on the client tier, server tier, or the network link?
In this example, the top chart shows that a spike in Stalled transactions is correlated with a spike in PIE (Performance Impacting Events); the bottom chart shows that these events occurred on the client tier. With this information, you can then locate other correlated metrics and identify the issues on the client tier.
Basic Diagnosis
You now have a set of correlated network metrics and associated tiers/links. In many cases, this information is enough to identify and resolve the issue. You can contact your network team and say: I see the following network issues on tier X, link Y, and so on, and these issues correlate with performance issues in my application. You can send them a URL to the Network Dashboard and say: Click on link Y and look at the connections. The issues are happening on one or more of these connections. This often provides enough information for the networking team to identify and resolve the issue.

Network Dashboard (Advanced Diagnosis): On which TCP connections are these network issues occurring?
If you need to collect more information, you can drill down to the TCP connection(s) where the network conditions are occurring. Click the relevant network link and select Connections in the popup. Sort the table based on the KPI metrics for the monitored connections (Throughput, TCP Loss, PIE, Errors). You can then right-click a connection and view metrics in the Metric Browser, or in a context-sensitive dashboard.
By default, Network Agents do not monitor individual connections. The recommended workflow is to enable connection monitoring only after you narrow an issue down to a specific set of links. See Dynamic Monitoring Mode and Network Visibility

Transaction Diagnosis
I'm troubleshooting a specific outlier (Slow, Very Slow, Error, or Stalled) transaction. Are network conditions to blame?
Transaction Snapshots list: Is the network to blame for a specific slow, stalled, or error transaction?
You can diagnose the network performance for an individual transaction in the transaction viewer. Double-click a snapshot in a Transaction Snapshots list.
Transaction Snapshot viewer: Where (at which tier) are the delays, stalls, or errors occurring?
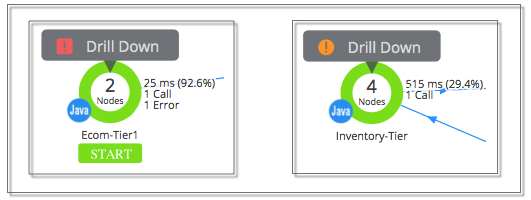
When the Transaction viewer appears, click Drill Down on the tier where the delays, stalls, or errors are occurring.
In the Tier Overview tab, click Network.
Network Dashboard for Transaction Snapshot: Are there any correlations between problematic transactions and network-performance issues around the time of this transaction?
The transaction dashboard shows the rate of transaction outliers, Performance Impacting Events, and Network Errors when the transaction occurred. Each chart has the Snapshot Time range highlighted. The Network Impact on Transactions chart (top left) highlights any correlations between transaction outliers, Network Errors, and Performance Impacting Events. You can then look for correlations in other charts and drill down to the root cause.

Network Health Check
Currently, I do not see any application issues, however, I would like to monitor my network and identify any potential issues before they start to affect my applications.
Network Dashboard: Is any tier or link performing outside its baseline?
To perform a quick network health check, go to the Network Dashboard and enable baselining. Elements with network KPIs that exceed the baseline for that element are colored yellow or red.

If the network KPIs for a tier or link are outside the performance baseline for that element, you can view baselines and outliers for that element in the Network tab of the popup. If an element has KPI outliers, you can also diagnose that element in a context-sensitive dashboard (right-click and select View Metrics).

Network Dashboard: Do any network links or connections have significant performance issues?
To see immediately if any links or connections have performance issues, open the Connections Explorer (click the Explorer link to the immediate right of the Network Flow Map). The KPIs of all network links and connections display in one table. You can sort the table based on KPIs or Errors, and expand each network-link to view KPIs for all connections within that link.

Example Use Cases