Download PDF
Download page Service Endpoints.
Service Endpoints
Works with:
![]()
![]()
In complex, large-scale applications, you (as an owner of specific application services spanning one or more logical tiers) may need metrics on your specific service instead of metrics across an entire business transaction or entire tier. You can use service endpoints to obtain a subset of metrics and associated snapshots for your service so you can focus on information important to you. Using service endpoints, you can define a set of entry points into your specific service to create a customized view in the AppDynamics UI and display key performance indicators, associated snapshots, and metrics that affect only those services. You can understand the performance of your service and quickly drill down to snapshots that affect your service, instead of sifting through snapshots for the entire tier or business transaction.
Difference Between Service Endpoints and Business Transactions
| Business Transactions | Service Endpoints | |
|---|---|---|
| Metrics Reporting/Tracking | Business transactions report metrics both at the entry and exit points | Service endpoints are similar to business transactions except that they report metrics only at the entry point, and do not track metrics for any downstream segments. |
| Entry Points | Business transactions are automatically detected | Service endpoints are not automatically detected; you must specify the entry points for service endpoints. Service endpoints support the same entry point types as business transactions and you configure them similarly. |
| Performance Metrics | Business transactions provide both performance metrics and full code visibility with call graphs | Service endpoints provide performance metrics only. |
| Calls | Business transactions are Checkout, Landing Page, Add to Cart, and so on, and are known by every end-user of the application. These business transactions cover all method executions, database calls, web service calls. | Service endpoints are the sub-calls (method call or web service call), which are executed inside the business transactions. For example, the Check Inventory service, is executed in both Checkout and Add to Cart transactions. |
Customize Service Endpoints
For Java applications, AppDynamics automatically detects and registers service endpoints. For either Java or .NET applications, you can configure custom service endpoint detection rules. See Service Endpoint Detection.
Service Endpoint Health Rules
You can create health rules to monitor the parameters that represent the normal or expected operations for your service endpoints. The parameters rely on metric values, for example, the average response time. When the performance of a service endpoint violates the conditions set by a health rule, a health rule is violated. Alerts notify you of any violation and initiate remediation actions to mitigate the violation event. It is important that you configure alerts appropriately to ensure that you do not miss any alerts or receive false alerts. 'Alert Sensitivity Tuning' (AST) helps you configure alerts with appropriate sensitivity. AST provides historical data for the metric or the baseline being configured, and helps you visualize the impact of the alerting configuration. To create a health rule to monitor service endpoint parameters and fine-tune the sensitivity of the health rule using AST, see Create a Health Rule and Fine-tune Metric Evaluation.
Monitor Service Endpoints
From the Applications navigation menu in the Controller, select Service Endpoints to view a list of service endpoints with key performance metrics.
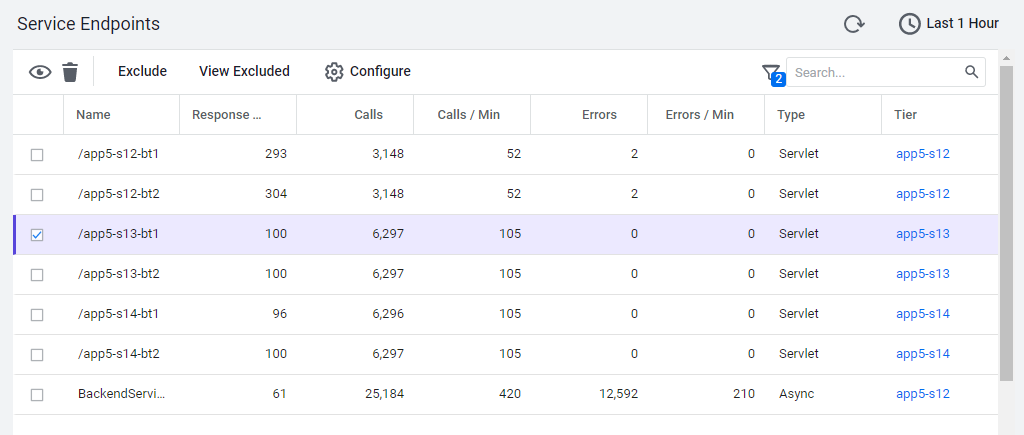
Service endpoints that contain performance data within the selected time range display in the list.
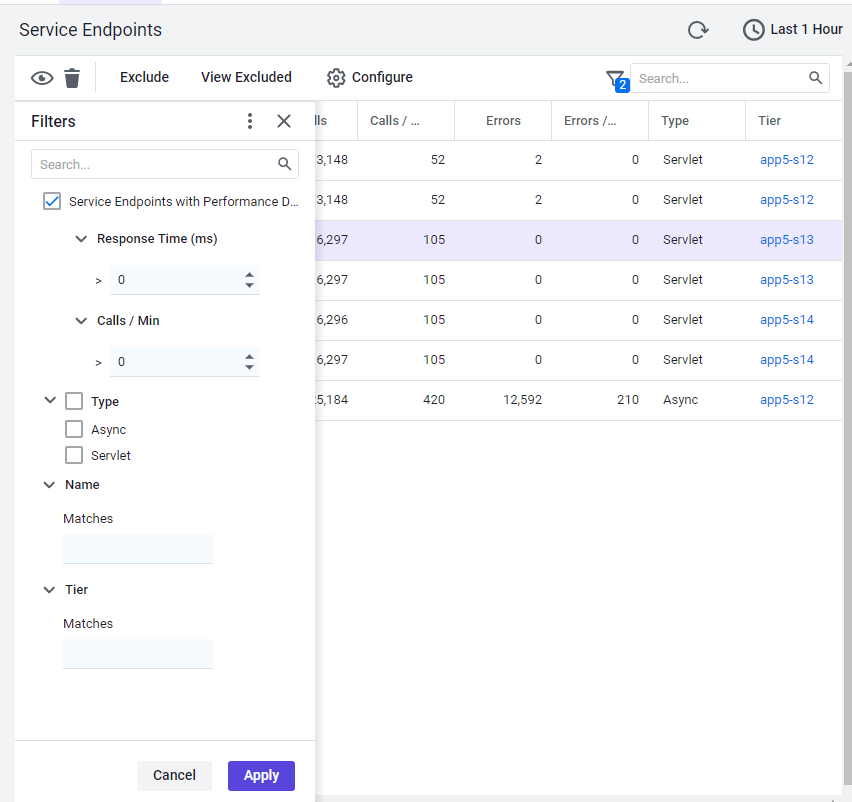
Select the Filter icon (on the top right of the page) to set various filtering options for active and inactive service endpoints within the designated time range. Other view options include showing transactions of certain types or ones that exceed a configurable average response time. After you set the desired filters, select Apply.
Additionally, you can view, delete, and exclude selected service endpoints by selecting the options from the top menu bar. Select Exclude to hide the service endpoint from the list.
To completely disable metric collection for the service endpoint, you can create an exclude rule by selecting Configure. See Service Endpoint Detection.
Diagnostic sessions are not intended to run in the context of a service endpoint alone. As a result, you cannot directly start a diagnostic session from a service endpoint. If you run a diagnostic session on the business transactions that include calls to the service endpoint, the transaction snapshots from these diagnostic sessions display in the service endpoint dashboard.
Service Endpoint Limits
A service endpoint adds a small amount of system overhead. Agents capture approximately three metrics per service endpoint, so monitoring each service endpoint results in additional metric traffic.
To prevent the possibility of a boundless expansion of service endpoints, the Controller and agent configurations apply these limits:
| Element | Limit | For more information |
|---|---|---|
| Application Agent | 25 service endpoints per entry point type | See max-service-end-points-per-entry-point-type on App Agent Node Properties Reference. |
| Java Agent | 40 asynchronous worker thread service endpoints | See |
| Node | 100 service endpoints | See max-service-end-points-per-node on App Agent Node Properties Reference. |
| Controller account | 4000 service endpoints | For an on-premises Controller, the limit is configurable using the sep.ADD.registration.limit configuration property accessible in the Administration Console. |
| Execution thread | 1 endpoint | See max-service-end-points-per-thread on App Agent Node Properties Reference. |
Service Endpoint Metrics
Service endpoint metrics display under Service Endpoints in the metric browser. Service endpoint metrics are subject to the same operations as other metrics, including those around metric registration, metric rollups for tiers, and limits on the number of metrics. Custom metrics are not available for service endpoints.