Crash snapshots provide detailed information for one application crash. When an instance of an instrumented application crashes, a crash snapshot is created.
The snapshot provides information to help you analyze the cause of the crash, including:
- Crashed function
- Source file containing the crashed function
- Line number in the source file, if available
- Stack trace of the application at the time of the crash
For iOS applications, crash snapshots are based on:
- Fatal signals (SIGSEGV, and so on)
- Unhandled Objective-C exceptions
For Android applications, crash snapshots are based on unhandled Java exceptions.
Crash Snapshot Details
The Crash Snapshot Details dialog has the two panels Crash Summary and Crash Distribution. The Crash Summary panel displays basic crash information and the stack trace. The Crash Distribution panel displays widgets with distributed crash metrics by the crash group and the stack trace.
To view crash snapshot details:
- From the Records tab, select a crash snapshot in the list.
- Click View Details.
Crash Summary
The Crash Summary panel of the snapshot displays the key properties of the snapshot. If you have customized your instrumentation (Android/iOS) to include breadcrumbs, they are displayed in the Events Prior to Crash panel. Up to 99 breadcrumbs display, beginning with the most recent. Not all of this information may be available. If you added user data (Android/iOS), it also displays here.
The Stack Trace panel displays the call stack of the crashed application, showing the thread in which the crash occurred. This is the full stack trace for this specific crash, not the aggregated stack trace shown in the Unique Crash Dashboard. You can view the formatted stack trace that groups threads and parses the output or the raw log output for the stack trace.
Click Download to access the stack trace in a file that you can forward to developers or port to logging platforms. To see the crash in the context of the mobile session, click View Session.
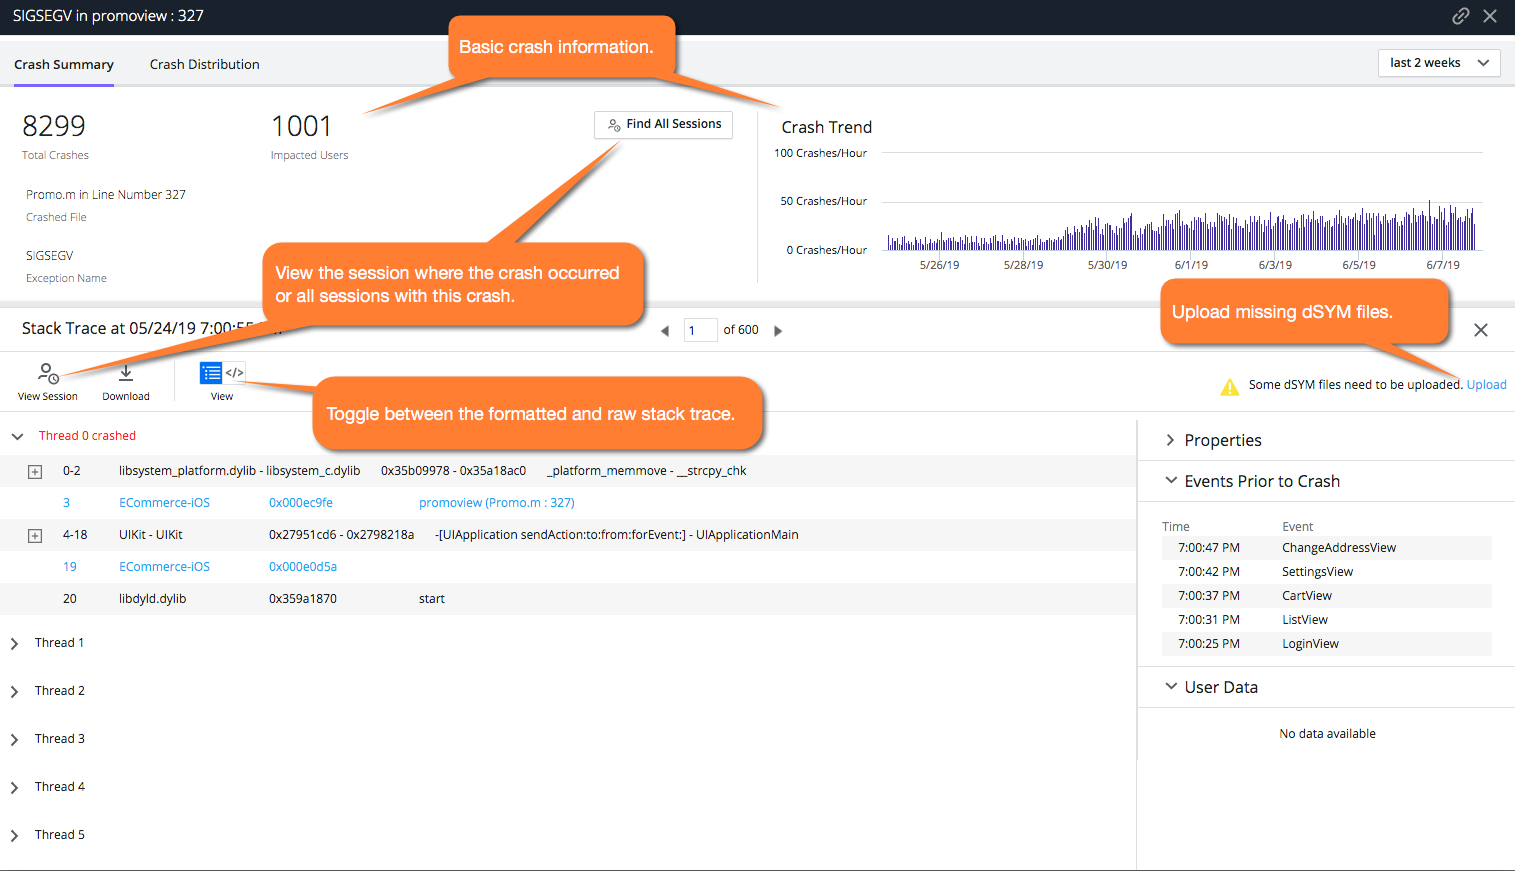
If the information in the stack trace is cryptic, it is possible that source code for your iOS app was not symbolicated or the source code for your Android app was obfuscated. See Get Human-Readable Crash Snapshots for information about why this happens and what you can do about it.
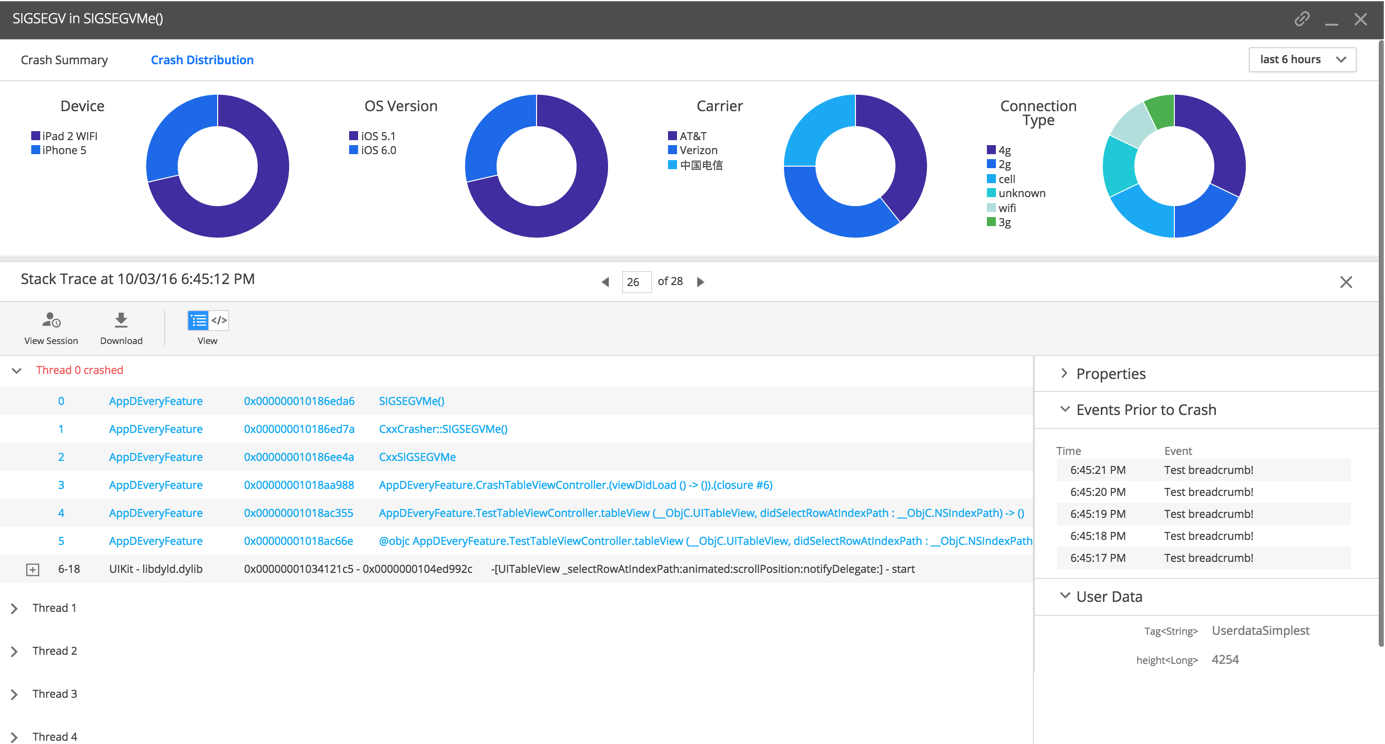
Crash Distribution
The Crash Distribution panel displays smaller-sized widgets from the Charts tab with distributed metrics for the crash group and the stack trace.