Download PDF
Download page Browser Synthetic Metrics.
Browser Synthetic Metrics
Related pages:
Many of the metrics collected by Browser Synthetic are identical to those collected by Browser RUM. Additional synthetic-only metrics are defined in Browser Synthetic Metrics Defined.
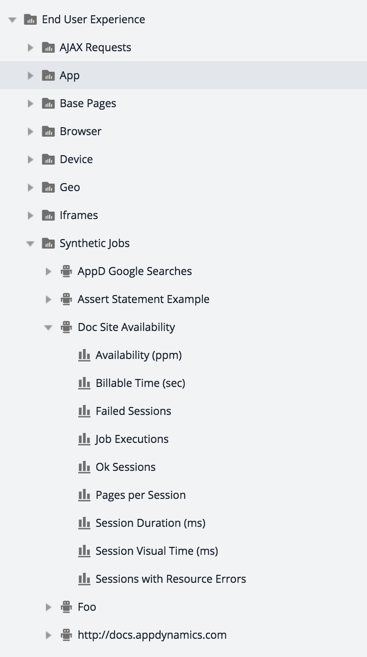
Key Browser RUM metrics are displayed on the Geo, Sessions, and Pages dashboards. They can also be seen in the Metric Browser, just like RUM metrics, giving you the ability to view these metrics in the context of Ajax requests, iframes, applications, base pages, browsers, devices, and geographic locations.
Metrics will only appear in the Metric Browser if there is synthetic data. For example, if your synthetic jobs do not have failed sessions, the metric Failed Sessions will not appear.

There are also metrics for specific tests and, under the Synthetic Jobs heading, for Synthetic job health overall.
Browser Synthetic Metrics Defined
Name | Definition |
|---|---|
| Availability | The ratio of Availability is represented in per-million instead of as a percentage because Controller metrics are given as integers, making expressing the availability as a percentage less precise. For example, although the availability percentage in actuality might be 99.99%, it would only be able to be expressed as an integer such as 100% or 99%. To convert per-million to a percentage, just divide by Availability (ppm) by 10,000. For example, if Availability (ppm) is 999,800, then Availability (%) is 99.98%. Most Controller UI components display metrics as percentages, but the Metric Browser, which shows "raw data", shows the value per-million. |
| Billable Time | The seconds that were billed against your Synthetic license. |
| Broken Sessions | The number of sessions that completed with the session status BROKEN, indicating that the job has an error. You can find the error in the script console output. |
| Data Downloaded Before Fully Loaded | The bytes of data downloaded by the browser between the navigation start of a page and the navigation start of the next page or the end of the session. In particular, includes any resources loaded after the page load event. |
| Data Downloaded Before Onload | The bytes of data downloaded by the browser between the navigation start for a page and the load event for that page. |
| DOM Elements per Pageview | The number of DOM elements present on a page at the time of the page's load event. Includes sub-documents in frames. |
| Failed Sessions | The number of sessions that completed with the session status FAILED, indicating the synthetic test has detected a problem with your site. See Session Status for more information. |
Fully Loaded Time | The time from the start of the initial navigation until 2 seconds of no network activity has passed after Document Complete. This will usually include any activity that is triggered by JavaScript after the main page loads. The Fully Loaded Time is given in milliseconds and percentiles. |
| Job Executions | Total number of sessions (per browser, per location) for a given job. |
| Number of Resources Loaded Before Fully Loaded | See Data Downloaded Before Fully Loaded above. |
| Number of Resources Loaded Before Onload | See Data Downloaded Before Onload above. |
| Ok Sessions | The number of sessions that completed with the session status OK, indicating the synthetic job ran successfully and returned data. |
| Pages per Session | The number of pages per session. |
| Session Duration | For scripted jobs: the time needed to execute the script from the first line to the last line. For URL jobs: the time from when the browser initiated the first HTTP request until the last resource was loaded. |
| Sessions with Resource Errors | The number of sessions that had missing or inaccessible resources. |
| Session Visual Time (SVT) | This metric captures the time the browser spent loading pages. Relative to Session Duration, this excludes the script process time and the time your script was interacting with content on a given page. Specifically, the Session Visual Time for a session is the sum of the Visually Complete Times for each page. |
| Speed Index | This metric captures whether a page renders incrementally or all at once. For example, if two pages both take five seconds to finish rendering, but one is mostly rendered after a second, while the other is blank until the last moment. Then the first page will have a Speed Index close to 1000, while the second will have a Speed Index close to 5000 (the Visually Complete time in milliseconds). |
Visually Complete | The time when an end-user would determine that the page is visually complete in the viewport. This time is calculated by using the last visual change to the page and is in milliseconds. The page represents the viewable content (the viewport) in a browser window. The default size for a browser window is 1024 x 768. |
| Warning Sessions | The number of sessions that completed with the session status WARNING, indicating the test ran successfully, but there were inaccessible resources. |