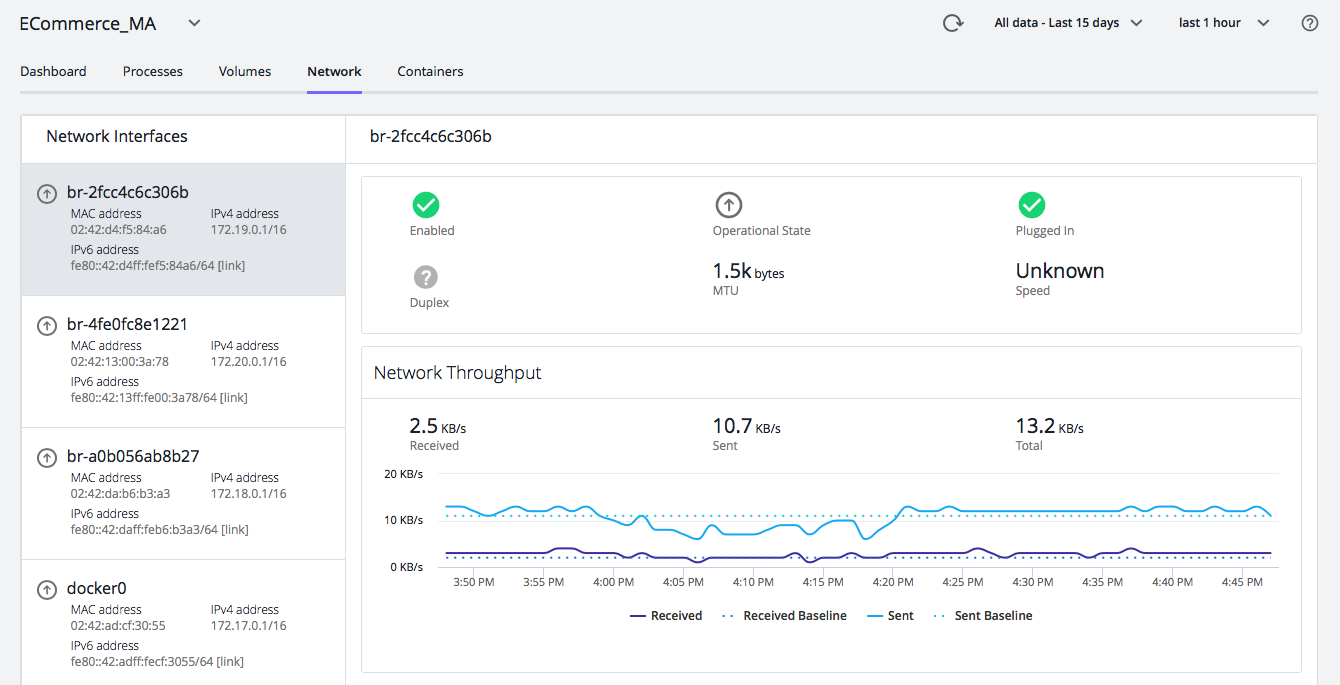
AppDynamics APM Platform 21.x Infrastructure Visibility Server Visibility Monitor Your Servers Using Server Visibility Current: Server Network Metrics PDF Download PDF Download page Server Network Metrics. Current page All pages Server Network Metrics To access Server Network Metrics, select AppDynamics Home > Servers > double-click server > Network.From the Server Network tab, you can:View the MAC, IPv4, and IPv6 IP address for each network interface.View the state of the network interface:EnabledFunctional (its operational state)Equipped with an Ethernet cable that is plugged inOperating in full or half-full duplex modeView the maximum transmission unit (MTU) or size (in bytes) of the largest protocol data unit that the network interface can passView the speed of the Ethernet connection in Mbit/secView network throughput in kilobytes/sec and packet trafficChange the time period of the metrics displayedHover over any point on a chart to review the metric value for that time If no metrics display, the network device speed cannot be found for some devices and some Linux versions. Server Network MetricsThese columns are available for the Server Network panel.For the selected network interface:Network Throughput received: The volume of data received per secondNetwork Throughput sent: The volume of data sent per secondPackets per sec incoming: The number of data packets received per secondPackets per sec outgoing: The number of data packets sent per second ×