Using percentiles can be a good way to reduce the impact of extreme outliers in performance metrics, which can be useful in the often noisy environments of end-user experience monitoring. Percentiles also display in the Metric Browser.
You can:
- Enable or disable percentile display of metrics.
- Set up to four different percentile levels to be applied to metrics.
From the Configuration > Mobile App Group Configuration, click the Settings tab and navigate to the Configure Percentile Metrics section.
You can change the percentiles which are used to evaluate data via the Events Service.
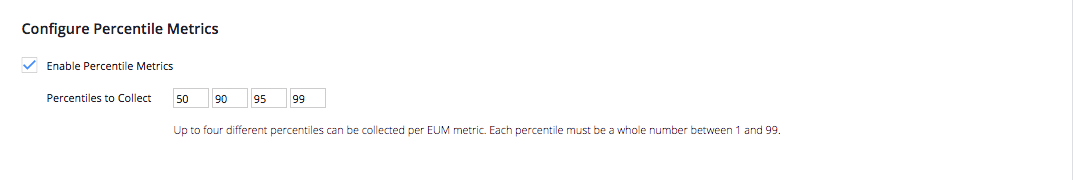
- Check the box to enable percentile metric display.
- Add up to four percentile levels to collect. Each value must be a whole number between 1 and 99.
If you change the percentiles to collect new values, it takes time for the recalculation to occur. If you review the Metric Browser, you will see metrics based on the old percentiles until the moment that you update the values, when they change to reflect the change.