Download PDF
Download page Business Transaction Discovery Sessions.
Business Transaction Discovery Sessions
Business Transaction Discovery Sessions provide interactive tools to help you create the optimal set of transaction detection rules and discover crucial business transactions.
During a discovery session, you can preview the effects of all the transaction detection rules on a node. This way you can create rules that capture the precise business transactions that impact your business and avoid rules that generate too many transactions.
Within the context of the discovery session, you can:
- Edit Java Agent transaction detection rules and Preview Business Transactions. (Java only)
- Identify entry points from Uninstrumented Code.
- Browse Classes/Methods to identify entry points.
During the business transaction discovery session, you can test out various transaction detection rule configurations without impacting your production environment.
Any business transactions discovered within the context of the discovery session, called transient transactions, do not persist after the session ends. When you end the session you have the opportunity to discard the rule changes or to apply them to your production configuration.
Permissions
 You need the following permissions to launch a Business Transaction Discovery Session:
- Configure Transaction Detection
- View Sensitive Data
For information on AppDynamics Role Based Access Control, see Roles and Permissions.
Launch a Business Transaction Discovery Session
- Navigate to Configuration > Instrumentation and click the Transaction Detection tab.
Click Live Preview.
- Click Start Discovery Session to start a Business Transaction Discovery session.
Select the node to act as the source of the live data stream.
Nodes are organized by tier. You can see which nodes have active agents and if there is a discovery session already running on a node.
The Transaction Discovery page displays information about the discovery session lets you navigate among the available interactive transaction discovery tools:

The transaction discovery tool works as it did in previous versions for upgraded business applications. See .Business Transaction Discovery Sessions v21.1.
When you initiate a transaction discovery session on a Java node, the Rules pane displays the active transaction discovery rules that apply to the node. The right-hand pane lets you Preview Business Transactions or use the available interactive Tools: Uninstrumented Code detection and the Classes/Methods Browser.
When you launch a discovery session on a .NET node, you see the available tools: Uninstrumented Code detection and the Classes/Methods Browser.
During a discovery session, you can use other features of AppDynamics while the discovery process continues in the background. This is useful for busy environments with many active transactions. You can give AppDynamics a few minutes to complete the discovery. When you are ready to return to the Transaction Discovery page click Configuration > Instrumentation and click the Live Preview button to resume your discovery session.
Edit and Preview Transaction Discovery Rules
You can add, edit, or delete any type of transaction detection rule for the Java Agent in the Rules pane. Click Apply to update the rule within the context of the discovery session.
To see the effects of your changes, click Preview Business Transactions. As the app agent discovers business transactions based on the rule configuration, the transactions show up in a list in the right-hand pane:

You can select a transaction and click Capture Snapshots to collect transaction snapshots.
The Capture Snapshots feature is only available for Servlets.
Click a specific snapshot to display the payload data for the business transaction in the Snapshot Details:

When you create custom match rules for servlets or for POJOs you can start a Live Preview session limited to the specific rule.
Inspect Uninstrumented Code to Discover Entry Points
When the app agent doesn't automatically discover an entry point for a framework in your application, you can use Uninstrumented Code detection to find entry points for the framework. After you identify an entry point you want to track as a business transaction, you can create a custom match rule.
Uninstrumented Code detection identifies the support exit calls for an app agent on the node when the entry point is undetected. In the following example the Java Agent discovers some uninstrumented JDBC exit points:

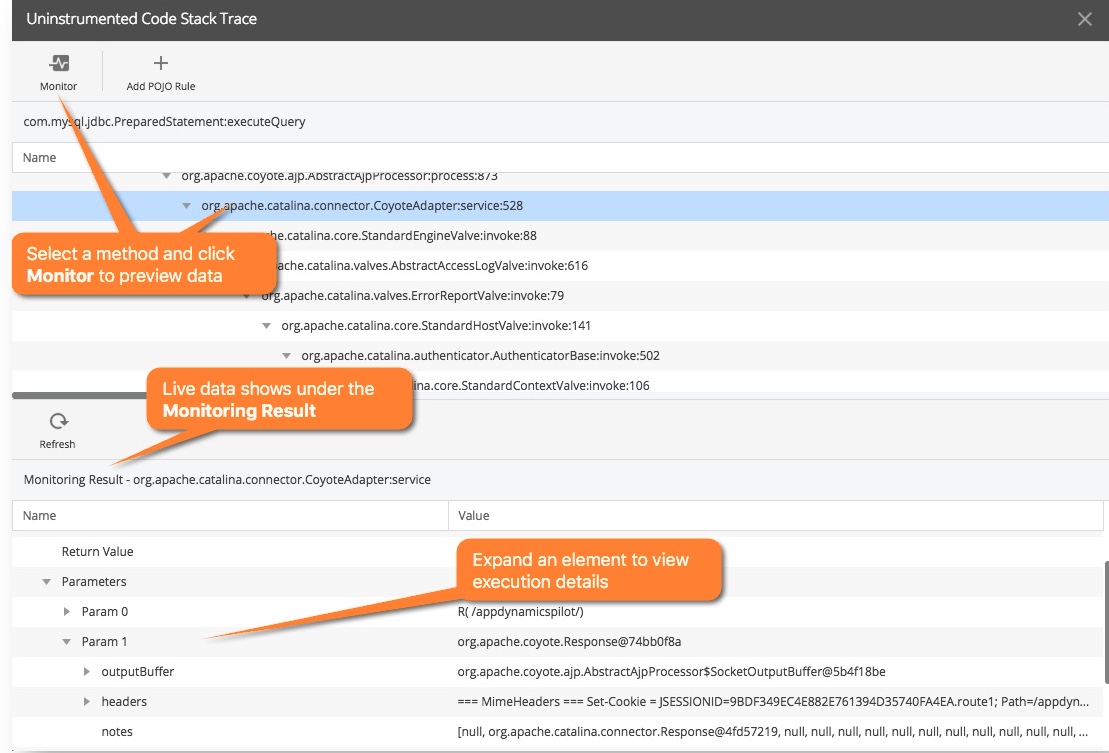
You can select an exit point and click View Stack Trace to display the call stack for the exit point. Select any call in the stack trace and click Monitor to show interactive data for that specific call. When the agent returns the monitoring result, you can inspect the values for a specific method invocation including the Invoked Object, Return Value, Parameters, and more.
The example below shows the upstream stack trace for the com.mysql.jdbc.PreparedStatement:executeQuery JDBC exit call:

When you identify the method you want to instrument, you can click to add a POJO or POCO. The Controller UI automatically populates the Rule Configuration in the Add Rule editor with the class and method you want to instrument. Complete the custom match rule for the POJO or POCO as normal.
Search for Classes and Methods to Instrument
If you are familiar with your application code, you can use the Classes/Methods browser to search the running code for specific classes and methods to instrument. The example below illustrates how a search for jetty.server in a sample application returns both instrumented and uninstrumented classes and methods:

When you identify a method you want to instrument, right-click the method to open the Add Rule editor. AppDynamics automatically populates the class and method configuration based upon your search criteria from the Class/Method browser. You can right-click a class to instrument it, but you must add the method before you can save the POJO or POCO. Complete the custom match rule for the POJO or POCO as normal.