Download PDF
Download page Dynamic Baselines.
Dynamic Baselines
This page describes how AppDynamics automatically calculates the baseline performance for your applications. After it establishes these prevailing performance characteristics, it can detect anomalous conditions for your application. AppDynamics uses baselines to:
- Color the Flow Map.
- Show transaction score dashboards.
- Compare metrics in metric graphs and the metric browser.
- Evaluate health in health rules (see Health Rules).
How Baselines Work
AppDynamics calculates baselines by using the underlying hourly data. A baseline can be calculated for every metric. Baselines have two main variables:
- The time over which accumulated data should be considered in calculating the baseline.
- Seasonality of the baseline.
Use Baselines to Identify Trends
Performance expectations can differ between hours of the day, days of the week, or even months of the year. For example:
- A retail application may experience heavier traffic on the weekend than the rest of the week.
- A payroll application may experience a higher load at the beginning and end of the month compared to the rest of the month.
To account for this variation, you can use a rolling time period as the baseline context. A rolling time period establishes the baseline against data from the current hour taken at a daily, weekly, or monthly interval over the course of the time period.
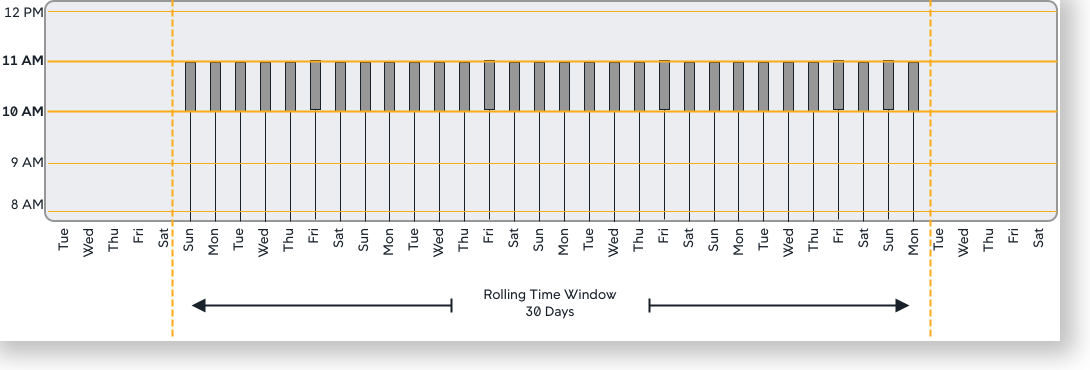
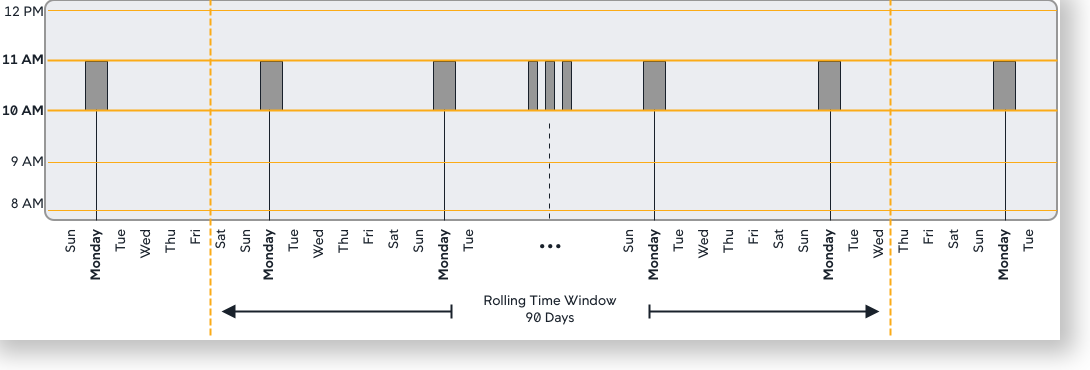
For example, you can have a baseline that uses a daily trend with a time period configured for 30 days or a weekly trend with a time period of 90 days.
A daily trend calculates the baseline from the data accumulated at the same time each day over the last 30 days.
A weekly trend calculates the baseline from the data accumulated on the same hour and day of the week over the last 90 days. This is one of the available default configurations.
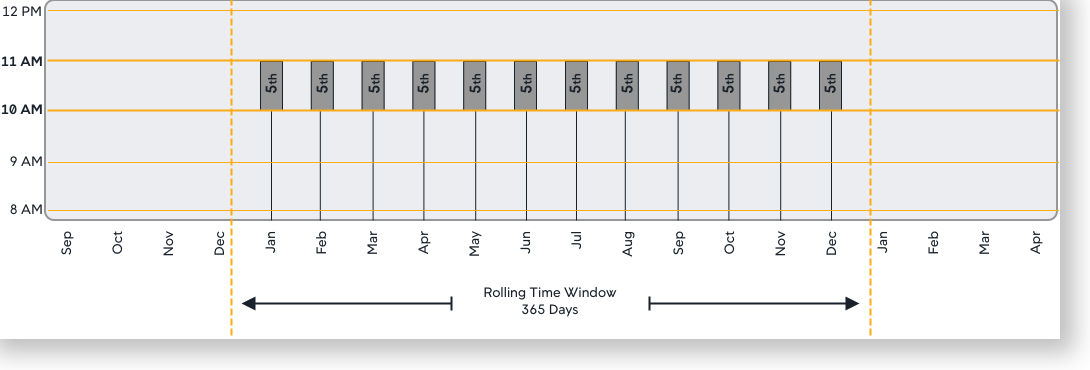
A monthly trend calculates the baseline from data accumulated at the same hour and same day of the month. So, for example, on January 5th at 10:30 AM, the baseline is established based on data accumulated at the same hour on the 5th of each month for the prior 365 days:
Baselines are not available immediately upon startup. It takes time and application load for the AppDynamics platform to collect data and create its initial baselines. The amount of time depends on the baseline type being used: daily, weekly, monthly, or none. Using none requires several hours before a baseline is available, daily takes several days, weekly takes several weeks, and so on.
By default, baselines are not computed for metrics if there are fewer than 20 calls per minute. To configure the calls per minute threshold, contact your AppDynamics account representative.
How are Standard Deviations Calculated
This standard formula is used to calculate the standard deviation:
standard deviation = sqrt [(B - A^2/N)/N]
where: A = sum of the data valuesB = sum of the squared data valuesN = number of data values
The standard deviation calculations differ based on the type of metric used:
- If the time rollup type = Sum or Average
- If the cluster rollup type = Individual or Collective
The cluster rollup type is applicable only at the tier or app level (node-level metrics will have the same calculations).
This example shows a standard deviation using metric types of:
- Time rollup type = Average
- Cluster rollup type = Collective
Metric - Calls Per Minute (Average, Collective)(Hourly Metric Table)
| Time | Sum | Count | Weight-Value | Weight-Value-Squared |
|---|---|---|---|---|
| 180 | 2 | 180 | 300 |
| 300 | 2 | 300 | 780 |
| 150 | 2 | 150 | 195 |
For these metric values, the baseline of type = All Data lasts three hours (at 12:00) using the above values for calculations.
With daily, weekly, or monthly seasonality, the data points considered are values for the same hour for all days, the same day of the week, or the same day of the year, respectively.
In this case, the baseline calculations will be:
Value = (180+300+150)/360 = 1.75
Standard deviation = sqrt(((300+780+195) - (((180+300+150)^2)/360))/360) = 0.69
Configure and View Baselines
A baseline deviation is the standard deviation from a baseline at a point in time, represented as an integer value. You can set health rule conditions based on baseline deviations. For example, you can configure a warning condition as two standard deviations from the baseline and a critical condition as four standard deviations from the baseline.
To configure baselines:
- Navigate to Configuration > Baselines.
- All available baselines display in the list.
- The daily trend is the default baseline. This is the baseline used by health rules if another baseline is not specified during health rule creation.
Click Set as Default to choose another baseline in the baseline list as default.

Changing the default baseline changes the actual baseline for all existing health rules that rely on this default and do not specify another baseline. Be watchful of your existing baselines and health rule definitions before you select this option.
- Select the trend type to use.
Set the trend time period and the trend. The base time period is available in these two ranges:
- Fixed time range: from some specific date and time to a second specific date and time. For example, if you have a release cycle at a specific time you might limit your data collection to that specific time.
- Rolling time range: in which the most recent X number of days is used. This is the more common choice.