Machine Agent and App Agent on the Same Machine, but Report to Different Nodes
Issue
A machine has a Machine Agent and an App Server Agent running together, however, the Agents report to different nodes. When you review the Metric Browser, for example, the application metrics appear under node abc but machine metrics appear under node abc.mydomain.com.
Resolution
Check if the hostnames match. If they do not match, then:
- Set the
<unique-host-id> for the Machine Agent to the same <unique-host-id> as the App Server Agent. - Restart the Machine Agent to apply the previous changes.
The <unique-host-id> on the Machine Agent and the <unique-host-id> for the App Server Agent must match exactly. These settings are case-sensitive and ensure that both Agents report metrics to the same node.
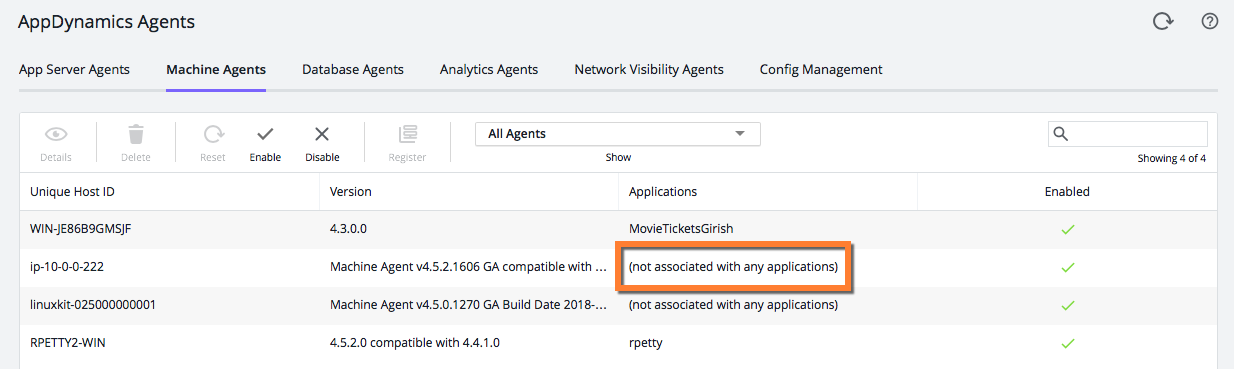
To verify that the hostnames match:
- Click the gear icon (
 ) in the Controller menu and select AppDynamics Agents.
 - Select the Machine Agents tab.
Review the Applications field for the Agent name.
In addition, for consistency in naming in the Servers tab, use the <machine path> attribute to set the hostname. By using the machine path, you do not need to use the fully qualified domain name (FQDN) for some Agents, and the hostname for others. The reported hostname is still available to view by checking the option in the Agents Admin view.
- Review the ID for the App Server Agent:
- Go to the App Server Agents tab.
- Search for the App Server Agent to which you want to associate the Machine Agent.
- Review the Unique Host ID field for the App Server Agent installed on that machine.
- Set the
<unique-host-id> for the Machine Agent to the same <unique-host-id> as the App Server Agent. - Restart the Machine Agent to apply the previous changes. Your Agents will appear as associated after a few minutes
.NET Agent Doesn't Appear on Machine Agent List
Although .NET Agents can report Machine Agent metrics, they are not considered Machine Agents. .NET Agent-instrumented machines are not included under the list of Machine Agents in the Controller UI.
Identify the Machine Agent Process
Linux and Unix-like Systems
To identify which process is running the Machine Agent, enter:
ps -ef | grep machine
CODE
Windows Systems
In the Windows Services Application, search for the AppDynamics Machine Agent service.
Metric Values for Disk and Network are Zero
When a 32-bit JRE is used with a 64-bit operating system, you may see values of zero for disk and network metrics. To solve this problem, use a 64-bit JRE with the 64-bit operating system.
Flow Maps and the Machine Agent
The Machine Agent monitors a particular machine (also called "host server") and not a particular application server; therefore, the Machine Agent can report to multiple nodes running on the same machine. However, a flow map displays the communication between different nodes during application execution, or the business transaction flow from tier to tier. A Machine Agent cannot be a part of the flow and is not shown in the flow map.
Server Health Indicator
Health rule violations based on metrics monitored by the Machine Agent are included in the health indicator on the various application, tier, and node dashboards. The health indicator is driven by health rule violations in the given time period configured on hardware metrics collected by the Machine Agent. Some health rules are configured by default. To configure additional health rules, see Configure Health Rules and Configure Health Rules to Monitor Servers.