Download PDF
Download page Call Graphs.
Call Graphs
Related pages:
A call graph in a transaction snapshot shows the business transaction processing information on a particular tier that participated in the business transaction. A call graph lists the methods in a call stack and provides information about each call.
A call graph provides general information about the total execution time, the node name, the time stamp for the start of execution, and the unique identifier for the business transaction instance. You can use call graphs to diagnose performance issues and optimize the flow of a complex business transaction.
Call graphs are also captured by the Node.js Agent in process snapshots, which describe an instance of a CPU process on an instrumented Node.js node. See Event Loop Blocking in Node.js.
Call Graph Types
A call graph can be one of these types:
- Full call graphs capture the entire call sequence for the business transaction invocation. Call graphs exist for each monitored node involved in the processing of the business transaction. Periodically collected and diagnostic snapshots are always full call graphs.
Partial call graphs represent the subset of the call sequence for processing a business transaction, typically from the point at which the transaction has been determined to be slow or have errors. Partial call graphs are identified in the transaction snapshot.
View Call Graphs
To view a call graph:
- Open the dashboard for the business transaction for which you want to see a call graph and click the Transaction Snapshots tab.
- In the transaction snapshot list, double-click a snapshot.
- Click the Drill Down link for the tier on which you want to see a call graph. An asterisk next to the link means that multiple calls are made at this tier for the transaction, which a dialog offers as choices to drill down into.
In the panel, the method execution sequence shows the names of the classes and methods that participated in processing the business transaction on this node, in the order in which the flow of control proceeded.
For each method, you can see the time spent processing and the line number in the source code, enabling you to pinpoint the location in the code that could be affecting the performance of the transaction.
The call graph panel includes UI controls for navigating large call graphs. For example, you can use the filter field to display only a particular method or types of methods. When you find a method of interest, you can set it as the root method in the tree to view only the portion of the call graph that occurs from that point forward.
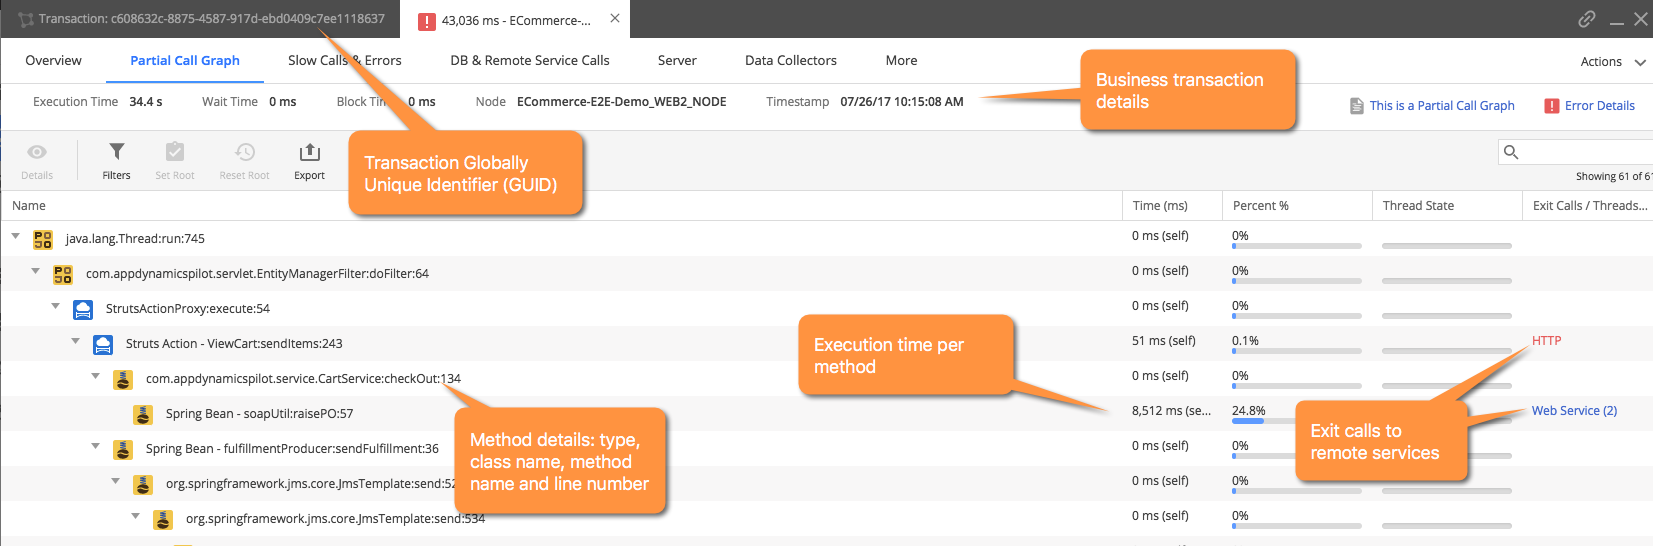
The call graph displays exit call links for methods that make calls to outside applications and services such as database queries and web service calls. Exit calls that do not exceed a minimum time threshold may not be represented.
SQL Query Exit Calls in Call Graphs
Often times application code executes database calls in multiple phases. For example:
- Construct and execute a SQL query
- Iterate over the result set
For example:
stmt = con.createStatement();
# Execute the query
ResultSet rs = stmt.executeQuery(query);
# Iterate through the results
while (rs.next()) {
	String PizzaType = rs.getString("PIZZA_TYPE");
    float price = rs.getFLoat("PRICE");
}The Java Agent represents JDBC SQL query executions and the iterations over the result set display separately in the call graph:
- For the execute call, the call graph shows the SQL query and the execution time. You can access the exit call details through a database link in the External Call column.
- For the iteration over the result set, it shows a count for the number of iterations and the total time. You can access the exit call details through a result set iteration link in the External Call column.
The .NET Agent does not separate ADO.NET SQL query execution exit calls from iteration over the result set in the call graph.
The Python Agent and the Node.js Agent sometimes separate out iterations as separate exit calls based upon the database driver used to make the call.
AppDynamics does not always represent every database call as a separate exit call. Therefore you may see a greater number of database calls than the actual number of exit calls in the call graph.
Minimum Capture Threshold Times for SQL Calls
The query and result set iteration are both subject to the minimum capture threshold times for SQL calls (which is 10 ms by default). If the execution time for a query or result set iteration does not exceed the threshold, then it does not appear in the call graph. This means that a given database interaction may be represented in a call graph in one of three ways depending on which parts of the operation took longer than 10 ms, if any:
- Only the query appears (Callout 1)
- Only the ResultSet iteration appears (Callout 2)
- Both appear (Callout 3)

Click the link to view more details for the SQL exit call, or the result set iteration.
Maximum Number of SQL Queries in Snapshots
By default, the maximum number of SQL queries in snapshots is set to 500. For Java Agents, you can increase the value of the max-jdbc-calls-per-snapshot node property if you do not see expected SQL queries in a call graph.
Request Root Node
The call graphs in transaction snapshots of the Node.js, PHP, and Python agents have an artificial root node named {request} .
For Python and PHP, the purpose of this node is to reconcile time differences between the total business transaction time and the sum of the observed call graph nodes, to act as a single entry point for the call graph, and to contain any exit calls which could not be attributed to any other nodes.
For Node.js, the {request} node in a business transaction call graph signals the availability of a process snapshot call graph that intersects with the transaction snapshot. If there is no {request} node, no process snapshot is available. See Process Snapshots and Business Transaction Snapshots.
Node.js Call Graphs
When the Node.js agent captures a complete call graph, the call graph tab of the transaction snapshot displays the total execution total time of the transaction, including wait times, at the top the call graph.
The execution time shown in the call graph pane is the sum of the times of the individual method calls inside the call graph. This value may be less than the total execution time because it does not include wait times between calls.
Display Excluded Classes in Call Graphs
The sequence of method invocations in a call graph may involve hundreds of classes. These classes include user application classes, framework classes (such as Tomcat or Websphere runtime classes), Java/J2EE core libraries, .NET Framework classes, and more.
Not all of those classes may be relevant to the type of troubleshooting you normally do. In most cases, your primary interests are the custom application classes you have built on top of the framework or language platform. Other classes may be needed, but only on rare occasions.
To make the call graph more readable and to avoid the overhead of processing the timing information for non-user-application classes, other classes are not shown in the call graph.
If packages (Java) or namespaces (.NET) have been excluded, you can click the packages/namespaces have been excluded link to view the packages, and optionally configure the classes to be included in call graphs.
Configure Instrumentation
You can right-click any item in a call graph and select Configure Instrumentation for this Class/Method.

The Configure Instrumentation panel presents a drop-down from which you can select the type of configuration that you want to create for the method.