This page describes different options for viewing business transaction performance.
After verifying and refining your business transaction scheme, you can focus on monitoring business transaction performance. The monitoring and troubleshooting tools within the AppDynamics Controller UI provide a business transaction-oriented view of performance. For example, transaction snapshots tie together all the code call graphs across the monitored tiers that participated in processing a particular instance of a business transaction.
The business transaction list contains a high-level look at business application performance by transaction. You can click a particular business transaction to access additional information on the business transaction, such as information on slow performing instances of this transaction, errors, and the transaction analysis view.
The transaction scorecard summarizes the performance of a business transaction at the application, tier, or node level within a specified time range. It covers the number and percentage of business transaction instances (calls) that are normal, slow, very slow, stalled, or errors based on the configured thresholds for these criteria.
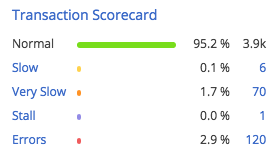
The call counts in the scorecards in different dashboards have different meanings:
- In the application dashboard, the business transaction health scorecard aggregates the metrics for all the completed business transactions in the application, including the default business transactions. The number of calls is based on the number of business transactions that are completed. The percentages for those calls are based on the average for all the completed business transactions in the application. For example, if the scorecard displays 3% for very slow transactions, on average 3% of the calls for completed business transactions in the application were slow.
- In a tier dashboard, the transaction scorecard aggregates the metrics for all the nodes in the tier. The number of calls is based on the number of requests that the tier handled, including continuing transactions, threads spawned, and so forth.
- A node dashboard is similar to the tier dashboard in that it is based on the number of requests the node handled. The transaction scorecard displays the metrics for the single node.
- In a business transaction dashboard, the transaction scorecard displays the metrics for the entry point of a business transaction.
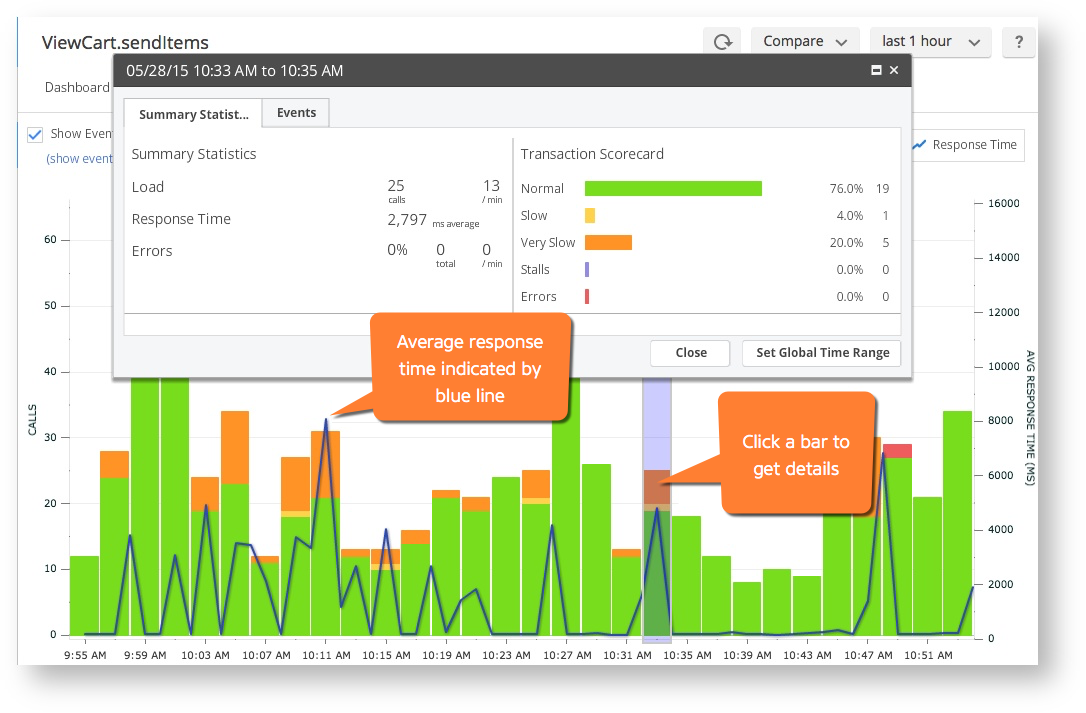
For a more detailed view of the performance of a transaction over time, navigate to the business transaction dashboard and click the Transaction Score tab. The graph in the tab shows the user experience for the selected business transaction, showing its performance relative to the performance thresholds as a bar chart.
For each time slot, the bar reflects the total calls, while the color segments—green, yellow, and so on—indicate the relative number of those calls that were normal, slow, very slow, stall, or errors.
The solid blue line in the graph indicates the average response time for the transaction over time, while the dotted line shows the baseline, if available.