Download page Network Congestion - Example Use Case.
Network Congestion - Example Use Case
Network congestion may be caused by:
A user may launch a "bandwidth-hogging" backup job during a period of peak network utilization.
A server may drop packets at seemingly random intervals due to a TCP misconfiguration.
Traditional monitoring tools such as SNMP are good at detecting persistent network bottlenecks, but often miss intermittent bottlenecks. With Network Visibility, you can easily identify and diagnose intermittent network bottlenecks that affect application performance.
Application Symptoms
A DevOps engineer is responsible for monitoring a mission-critical app. One day, she opens the Application Dashboard and notices that Ecom-Tier1 has suddenly gone partially red, which indicates performance degradation on one of the nodes in this tier. She also sees a small spike in response times for the overall application. She decides to investigate.
Network Diagnosis
To determine if there is a network problem, she:
Goes to the Transaction Snapshots page and filters the list to show only stalled calls.
Double-clicks a specific call to view the transaction flow map. Because it was a stalled call, the entire flow map does not display.
Clicks Drill Down to open the Transaction Dashboard, and then switches to the Network tab to analyze the network performance during this call.
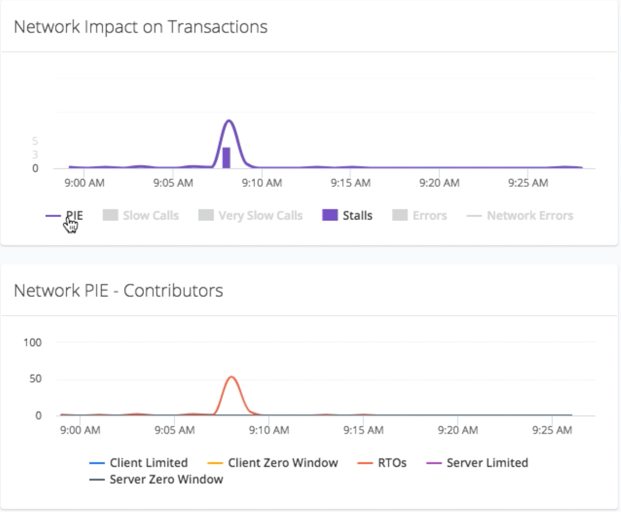
The Network Impact on Transactions chart (top left) shows a spike in Performance Impacting Events (PIE) around the time of the transaction snapshot. By showing only PIE and Stalls, she can see that the stalled calls and spike in PIE occur within the same time window.
In the Network Pie - Contributors chart, she can see that all the Performance Impacting Events are retransmission timeouts (RTOs). This indicates packet loss on the network paths between the two tiers, which is confirmed by the spike in TCP Loss that occurs within the same time window.
She knows there is a correlation between stalled calls and retransmissions, and wants to learn more about these events. The Retransmissions Per Min chart indicates that all these are all data retransmits, which indicate a problem on the network path between two nodes. (SACK retransmits indicate a problem setting up TCP connections on one or two nodes.)
In a few seconds, she has identified a chain of correlation: stalled calls > PIE > Retransmissions > Data retransmissions on a network path. The next step is to identify where in the network these retransmissions are occurring. She switches over to the Network Dashboard, and looks for network links with high PIE scores. She sees the PIE scores on two links are 59 (much higher than any other links). Both of these links are used by ECom-Tier1 and Ecom-Tier2 to connect with Order-Tier through a load balancer.
Given this information, she decides to investigate one of these tiers. She right-clicks Ecom-Tier1 and selects View Metrics. The Dynamic Dashboard for this tier appears. The dashboard shows the same metric correlations for the entire tier that she saw for the individual transaction.
Now that she has confirmed that data retransmissions are spiking for the entire tier, she wants to identify the TCP connections on which these events are occurring. She clicks the network link between Ecom-Tier and the load balancer. She can see that that PIE is occurring on both connections: ECOM_T1N1:8080 < – > Load_Balancer_10.0.11.77:8080 ECOM_T1N2:8080 < – > Load_Balancer_10.0.11.77:8080
Given this information, she contacts the network-management team in her organization and says: "I can see that there was intermittent loss from 9:07-9:10 AM on the following TCP connections, and that these correlate with a spike in stalled calls." The network team can now investigate the network paths used by these connections and determine if the problem exists on the load balancer or elsewhere.