Download PDF
Download page Experience Level Management.
Experience Level Management
The performance of business transactions and other types of events can affect user experience. Different levels of performance may correspond to service level agreements (SLAs), compliance targets, or compliance policies that your application must satisfy.
For example, an e-retailer might want to ensure that when customers add items to their carts, the transactions always complete within 100 milliseconds.
Experience Level Management (XLM) enables you to define experience levels. XLM shows you how your application is performing relative to those levels, in custom dashboards and in reports that you can view and export.
Working with XLM
Whether you speak of an experience level or a service level depends on whether your focus is user experience or SLAs, but you configure both through the same XLM UI. What this section says about experience levels applies equally to service levels.
You can define experience levels for any kind of data that meets the following criteria:
The data must be numerical.
The data must be individual (per event) values, not aggregates.
Since data collectors provide individual values, they are a good basis for experience levels as long as the values are numeric. By contrast, metrics and information points cannot be used as the basis for experience levels, because they provide aggregate values.
The following are all good bases for defining experience levels:
Sales in dollars per week during the time an ad campaign is running
Application response times calculated from business transaction events
End-user response times calculated from RUM and synthetic events
Custom analytics such as login times for platinum customers or item checkout response times for London customers
Compliance against the configured thresholds is calculated in daily intervals from the specified start date. The local time zone starting time for each day is converted to midnight of the equivalent Greenwich Mean Time (GMT) date. For example, 07/30 means 12:00 am GMT on 07/30. The reporting job that calculates the XLM data runs every day at midnight and noon GMT. The results are updated the next time the reporting job runs.
XLM aggregates the results of reporting jobs into weekly or monthly periods, according to your choice of Compliance Period settings, including Time Zone.
When viewing XLM data for a week or month, you can drill down into daily granularity. XLM also allows you to
- Create XLM reports in the time zone of your choice
- Export reports of however many reporting periods you choose, in CSV format
- Add your XLM report to a custom dashboard for periodic generation and delivery
You can export XLM configurations, and migrate them from one environment to another. You can also view and export the XLM Audit Trail, which automatically records XLM configurations and changes to them.
If you revise the configuration, the new configuration takes effect the next time the XLM reporting job runs. Past data is immutable and configuration changes do not affect the values.
To see which configuration was in effect at a particular moment in a reporting period, view the XLM Audit Trail.
Configuration Overview
In the XLM UI, you configure Properties, Compliance Target Settings, and optional Exclusion Periods.
- Properties specify what type of event to measure and what filters to apply.
- Compliance Target Settings specify the performance criteria you want XLM to report, through
- the Compliance Target, which defines the desired level of performance for the properties
- Daily Target Thresholds which define Normal, Warning, and Critical performance as percentages of the compliance target
- Treat Errors as Critical, an option helpful for applications where apparently normal performance thresholds tend to conceal errors
- Compliance Target Settings also specify how you want your XLM reports structured in terms of time, through
- the Start Date—the date you want the compliance calculation to begin
- the Compliance Period, which
- you can think of as the reporting period
- can be weekly or monthly; choose one or the other according to your SLA requirements
- the Time Zone of your choice
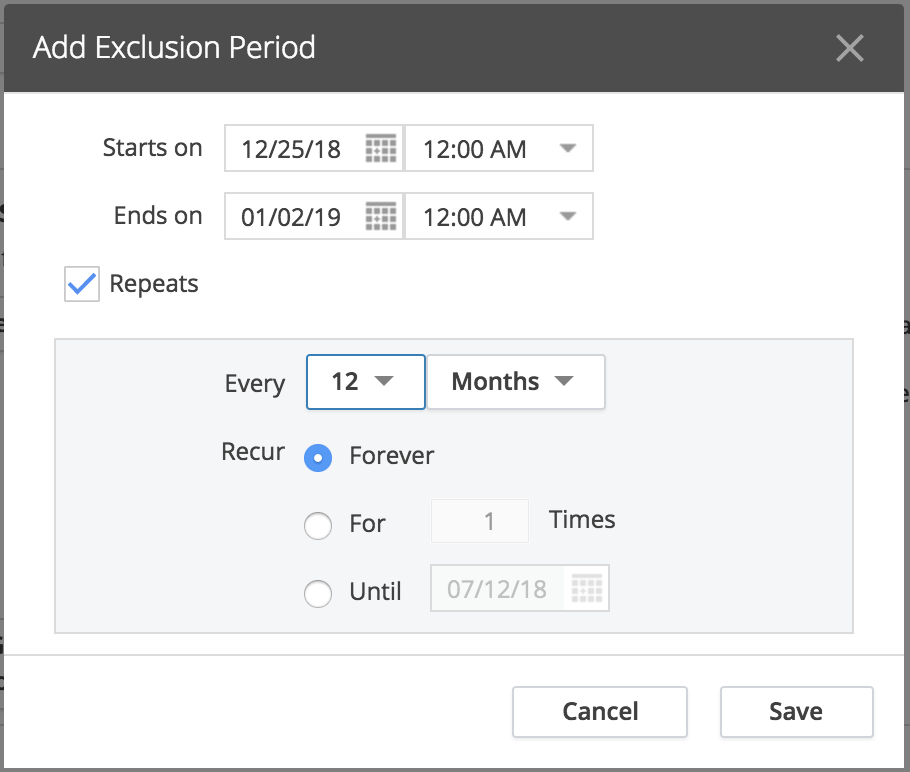
- Exclusion Periods help you account for performance deviations caused by upgrades, maintenance, or usage patterns associated with weekends or holidays.
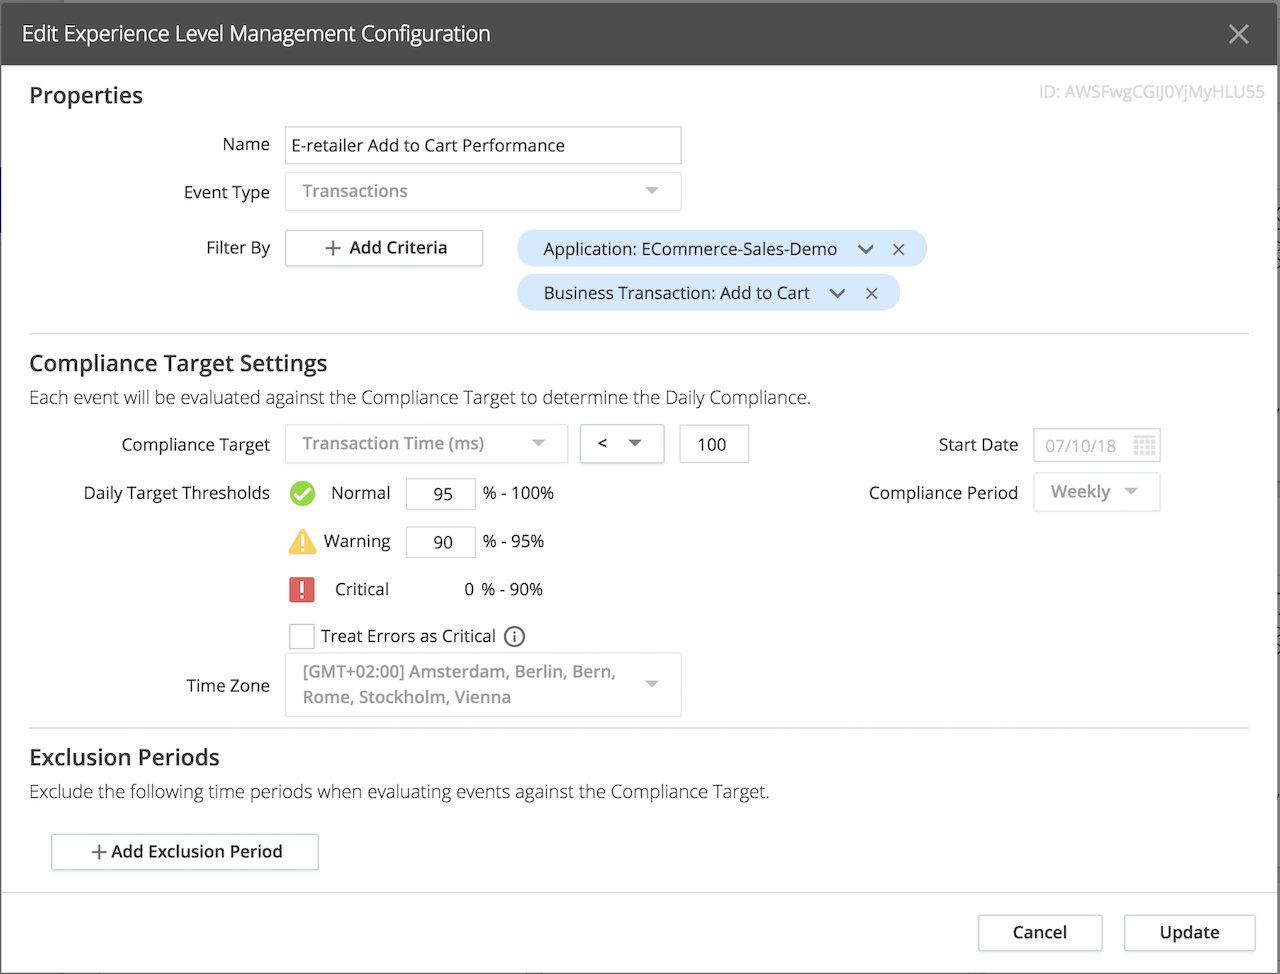
Here is how our e-retailer example might look:
- The properties have Transactions as the event type, filtered to exclude all but an Add to Cart business transaction, for the relevant application
- The compliance target is Response Time (ms), set to 100
- Values for daily target thresholds are 95% to 100% for Normal, 90% to 95% for Warning, and 0% to 90% for Critical
- The compliance period is Weekly
- The time zone is GMT+02:00 for Amsterdam, where our hypothetical e-retailer has customers
Configured this way, XLM reports that performance is Normal for each week-long reporting period when the Add to Cart business transaction completes within 100 milliseconds greater than 95% of the time.
For periods when Add to Cart performance meets the target 95% of the time or less, but above 90% of the time, performance is at Warning level.
For periods when performance meets the target 90% of the time or less, performance is Critical.
This example configuration is illustrated below.
XLM Exclusion Periods
Exclusion periods are time periods which you want to exclude from an XLM report.
For example, scheduled upgrades and maintenance can disrupt performance, so you may not want those periods reflected in XLM reports. Likewise, you may want XLM reports to exclude weekends, holidays, or other times with atypical usage patterns.
XLM queries executed against your Analytics event data observe only the exclusion periods you explicitly configure in the XLM UI. You configure exclusion periods using the time zone of your choice. Under the hood, Splunk AppDynamics keeps track of the exclusion period in the corresponding GMT dates.
XLM does not recognize exclusion and maintenance periods that you configure at the Controller level.
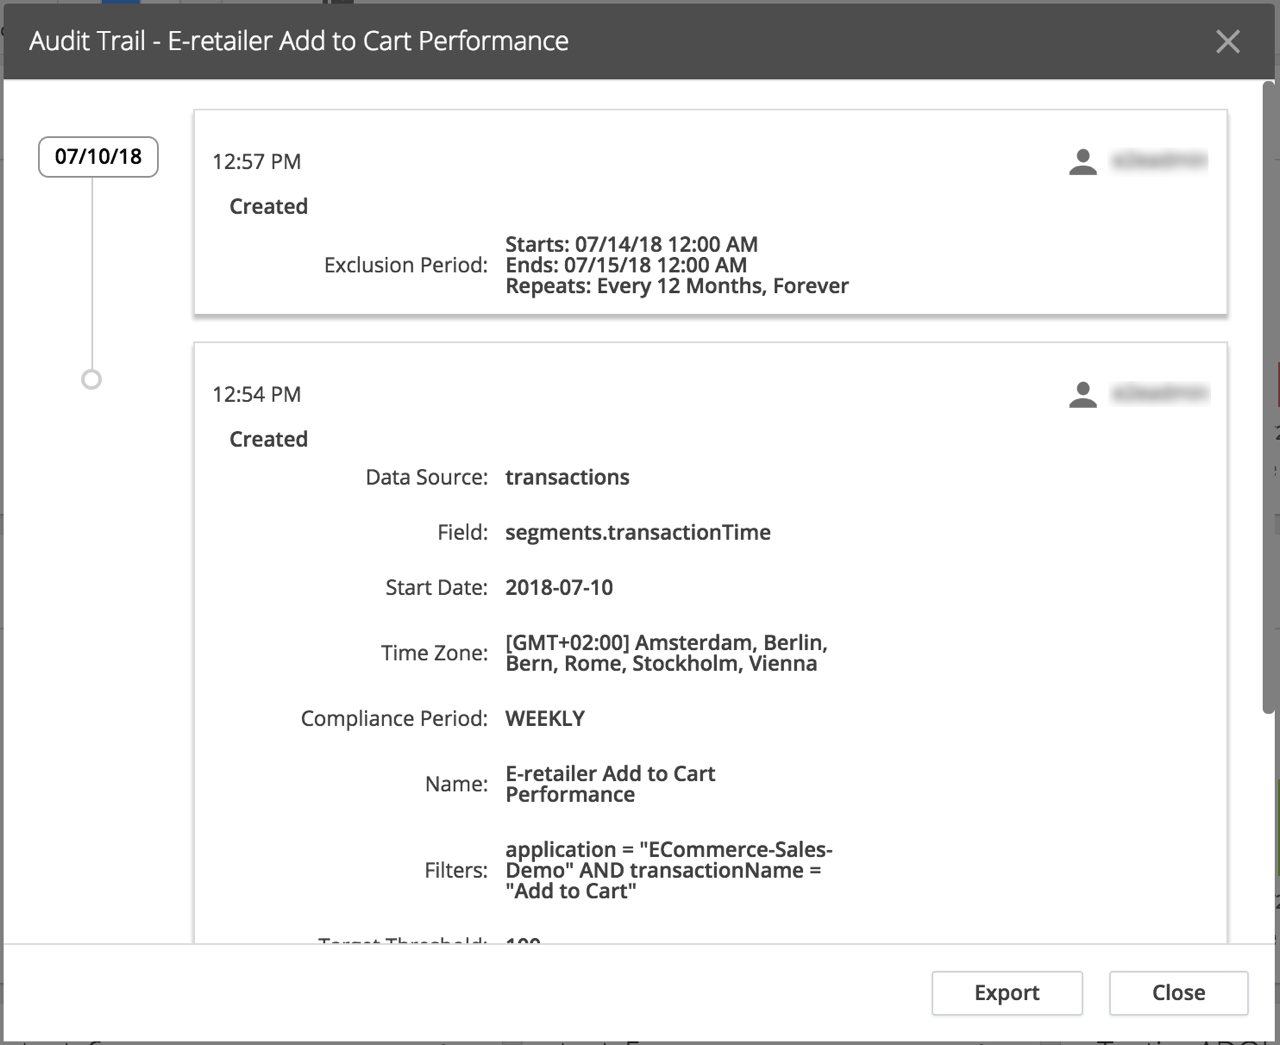
XLM Auditing
All changes to XLM configurations produce an immutable audit record called an XLM Audit Trail, which contains complete XLM configuration information. Since XLM audit reporting is separate from all other reporting in the Splunk AppDynamics Controller UI, the XLM Audit Trail is distinct from other available reports, such as the Controller Audit Report. You can export the XLM Audit Trail to a CSV file.
Each XLM configuration is limited to 1000 updates. If that limit is reached, the oldest audit records are dropped as new ones are added.
The XLM audit records contain information about what operations are performed and what fields are changed. The UI presents XLM audit records as a sequential timeline.