AppDynamics for Databases
2.9.x Documentation
| Appd tocbox | ||||||
|---|---|---|---|---|---|---|
On this page:
|
Use the Setup window to configure and administer your AppDynamics for Databases collectors.
...
The default Collector Administration window lists all configured collectors alphabetically. You can sort or filter the list using the controls above the table headings.
| Table of Contents |
|---|
| Include Page | ||||
|---|---|---|---|---|
|
| Include Page | ||||
|---|---|---|---|---|
|
After adding a collector, you can change its attributes if needed.
 1.
1.
...
...
For help changing the collector attributes, see Complete the Metric Collector Section.
Each collector has a Start/Stop button that starts or stops the collector service/process. The collector service/process has a name such as: DBTuna Agent - CollectorType.

To display the log file, click the Log icon in the table row. The log file, in reverse order from the end of the log. The most recent logs are at the beginning of the log file.
...
You can find the log files in <AppDynamicsInstallDir>in <Controller install directory>\Controller\logs.
AppDynamics for Databases stores historical performance information in a local MySQL database installed and configured during AppDynamics for Databases installation. The Archive Management window displays the total space used by the MySQL database, broken down by tables and indexes.
...
Data Retention Period: Specify the number of days to retain the archive of historical performance information for all monitored instances. The maximum data retention period is 999 days. If required, you can backup the MySQL database for long term or off-site storage. The data used by AppDynamics for Databases for its own purposes is retained in <installDir><ApppD4DB install directory>\MySQL\MySQL Server 5.6\data\mysql.
Purge Interval: Click an entry in the list to specify how often you want to purge the archive, Every Day or Every Hour.
Starting At: Using the 23 hr clock, click to specify the hour and minute when the purge activity should begin.
AppDynamics for Databases lets you organize monitored instances into logical named groups. By default a new collector belongs to the "0default" group.
...
In larger monitored environments you can quickly access an individual database by displaying collectors grouped in the Host menu. For example, this NetApp environment belongs to the Dev group:

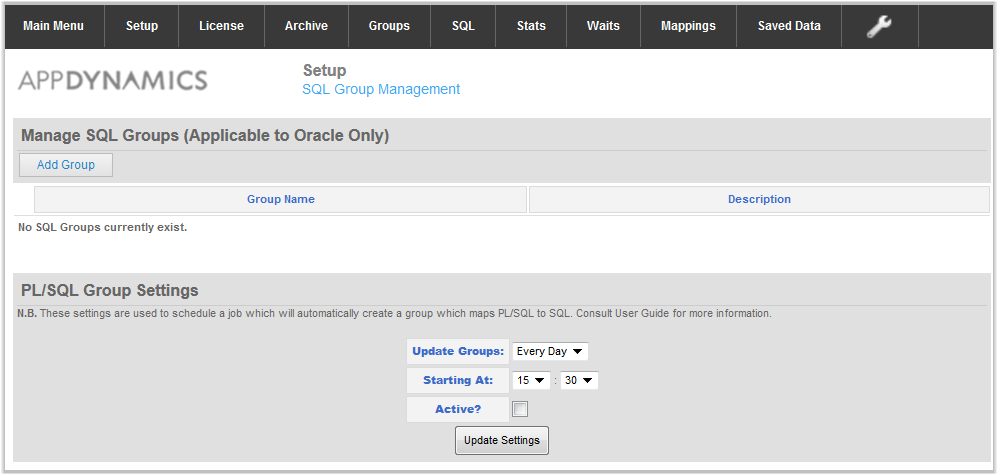
You can apply logical names to individual, or groups of, SQL statements. See SQL Group Management (Oracle Only).
Wait states appear in the Database Wait States Report, Database Wait Report
On the Waits window you can change the descriptions of the waits for Microsoft SQL Server (MSSQL), MySQL, and Oracle.

Depending on your environment, you may need to map your database to your NetApp volume in order to see database activity when you drill down from the NetApp volume into the NetApp Activity window in AppDynamics for Databases.
...